
Start your free trial
Verify all code. Find and fix issues faster with SonarQube.
Get startedTL;DR overview
- Part 3 of the .NET developer's guide shows how to integrate SonarQube analysis into Azure DevOps and GitHub Actions CI/CD pipelines for continuous, automated code quality enforcement on every pull request.
- SonarQube Cloud (SaaS) is recommended for most teams because it requires zero infrastructure maintenance, offers native integration with cloud DevOps platforms, and automatically receives the latest rules and language support.
- The automated workflow follows four phases—Prepare, Build, Complete, and quality gate enforcement—ensuring non-compliant code is blocked from merging before it accumulates as technical debt.
- Pull request decoration is highlighted as a key feature, surfacing analysis results directly in Azure DevOps or GitHub so developers can review findings without leaving their workflow.
In the previous installment of this series, we established a local analysis environment and performed a manual scan of a .NET solution. While manual execution is valuable for ad-hoc debugging, it does not scale in a collaborative team environment. Relying on individual developers to remember to scan their code introduces inconsistency and allows technical debt to slip through the cracks.
To enforce code quality effectively, analysis must be an integral, automated part of the software delivery lifecycle. In this installment, we will transition to Continuous Inspection by integrating SonarQube analysis into the two most prevalent CI/CD platforms for .NET developers: Azure DevOps and GitHub Actions.
Why SonarQube Cloud?
Before we dive into the YAML configurations, it is worth addressing why many teams opt for SonarQube Cloud (SaaS) over the self-hosted SonarQube Server.
While the core analysis engine, the Roslyn-based deep scanning, is identical between the two, the operational model differs significantly:
- Zero Maintenance: SonarQube Cloud is fully managed. There is no database to provision, no Java version to update, and no server OS to patch. Your team can focus entirely on code quality rather than infrastructure maintenance.
- Native DevOps Integration: It is designed specifically for cloud-based DevOps platforms. Features like Pull Request decoration and automatic project binding are streamlined for Azure DevOps and GitHub.
- Immediate Access to Features: New rules, improved analyzers, and language support updates are deployed to the cloud instantly. You are always analyzing your code against the latest standards without needing to plan an upgrade cycle.
For the configurations below, we assume you have already created a project in SonarQube Cloud and have your Project Key and Organization Key ready.
For more information setting up SonarQube Cloud, review the Getting Started Guide.
The architecture of automated analysis
Regardless of the CI platform, the fundamental workflow for .NET analysis remains the same:
- Prepare (begin): Download the Quality Profile and inject analyzers into the MSBuild pipeline.
- Build: Compile the code; the Roslyn analyzers execute during this phase.
- Complete (end): Aggregate results and upload them to the SonarQube Cloud.
In a CI environment, we introduce a critical fourth step: quality gate enforcement. Quality Gates are the sets of conditions that describe the criteria your project or PR should meet to be considered "good". When a project is first configured, a default quality gate is assigned to it. Ideally every project uses the same Quality Gate, but that - and gates themselves - are configurable. However it's best practice to make sure that every project meets certain minimum standards, so that, for instance, if the analysis detects critical bugs or security vulnerabilities, the pipeline fails, preventing the code from being merged or deployed.
Integration with Azure DevOps
Azure DevOps provides first-class integration through the official SonarQube Cloud extension. This extension abstracts the complexity of the command-line arguments into dedicated pipeline tasks.
1. Prerequisite: Service connection
Before configuring the pipeline, Azure DevOps must be authorized to communicate with SonarQube Cloud.
- Install the extension: Install the extension from the Visual Studio Marketplace.
- Create a service connection:
- Navigate to Project Settings > Service connections.
- Select New service connection and choose SonarQube Cloud.
- Enter your Scoped Organization Token from SonarQube Cloud (generated in your SonarQube Cloud Account Organization settings).
Note: Scoped Organization Tokens uses the principle of least privilege to assign access to resources. This means that permissions will be limited to what access and resources you define.
- Service connection name: Give this a descriptive name, such as
SonarQube Cloud-Connection.
2. CI/CD pipeline configuration (YAML)
The integration requires three specific tasks: SonarCloudPrepare, SonarCloudAnalyze, and SonarCloudPublish.
Note: Be careful to use the SonarCloud tasks, not the SonarQube tasks (which are for the self-hosted server).
trigger:

- main

pool:

  vmImage: 'ubuntu-latest'

steps:

# 1. Prepare Analysis Configuration

# This task fetches the Quality Profile and configures MSBuild.

- task: SonarCloudPrepare@3

  displayName: 'Prepare SonarQube Cloud Analysis'

  inputs:

    SonarCloud: 'SonarCloud-Connection' # Must match your Service Connection name

    organization: 'my-org-key'          # Your Organization Key from SonarQube Cloud

    scannerMode: 'dotnet'

    projectKey: 'corporate-finance-module'

    projectName: 'Corporate Finance Module'

    extraProperties: |

      # This property forces the pipeline to wait for the Quality Gate result.

      # If the Quality Gate fails, the pipeline will fail.

      sonar.qualitygate.wait=true

# 2. Build the Solution

# The actual analysis happens here during compilation.

- task: DotNetCoreCLI@2

  displayName: 'Build Solution'

  inputs:

    command: 'build'

    projects: '**/*.sln'

    arguments: '--configuration Release'

# 3. Run Code Analysis

# Collects the analysis data generated during the build and uploads it.

- task: SonarCloudAnalyze@3

  displayName: 'Run Code Analysis'

# 4. Publish Quality Gate Result

# Displays the Pass/Fail status on the Azure DevOps build summary page.

- task: SonarCloudPublish@3

  displayName: 'Publish Quality Gate Result'

  inputs:

    pollingTimeoutSec: '300'
3. Enforcing quality with branch policies
To strictly enforce quality standards, configure a Branch Policy on your main branch. To do that from Azure DevOps, perform the following
- Go to Repos > Branches.
- Select the
mainbranch and choose Branch policies.
Note: You can also configure Branch policies for other branches as well, which is preferred for repos with lots of team members.
- Add a Build Validation policy that requires the pipeline created above to pass.
With sonar.qualitygate.wait=true configured, any Pull Request that introduces issues violating your Quality Gate will break the build, preventing the merge.
Integration with GitHub Actions
For teams using GitHub Actions, the workflow relies on the .NET Core CLI and the global dotnet-sonarscanner tool. Unlike Azure DevOps, we script the begin/build/end workflow directly.
1. Secret management
Security best practices dictate that credentials should never be stored in plain text.
- Navigate to your GitHub repository's Settings > Secrets and variables > Actions.
- Create a Repository Secret named
SONAR_TOKENcontaining your SonarQube Cloud analysis token.
2. Workflow configuration (YAML)
Create a workflow file (e.g., .github/workflows/sonar-analysis.yml).
Here we will use a similar process as done previously, calling each part of the scanner individually
Key difference for cloud: Note the addition of the /o: switch in the begin command. This specifies the Organization Key, which is mandatory for SonarQube Cloud but not used for the self-hosted server.
  name: SonarQube Cloud Analysis

on:

  push:

    branches:

      - main

  pull_request:

    types: [opened, synchronize, reopened]

jobs:

  build:

    name: Build and Analyze

    runs-on: ubuntu-latest

    steps:

      # 1. Checkout Code

      - uses: actions/checkout@v4

        with:

          # Disabling shallow clones is recommended for accurate blame/history

          fetch-depth: 0

      # 2. Setup .NET

      - name: Setup .NET

        uses: actions/setup-dotnet@v4

        with:

          dotnet-version: 10.0.x

      # 3. Install SonarScanner Global Tool

      - name: Install SonarQube Scanner

        run: dotnet tool install --global dotnet-sonarscanner

      # 4. Begin Analysis

      - name: Begin SonarQube Scan

        run: |

          dotnet sonarscanner begin /k:"corporate-finance-module" \

            /o:"my-org-key" \

            /d:sonar.token="${{ secrets.SONAR_TOKEN }}" \

            /d:sonar.host.url="https://sonarcloud.io" \

            /d:sonar.qualitygate.wait=true

      # 5. Build

      - name: Build

        run: dotnet build --configuration Release

      # 6. End Analysis

      - name: End SonarQube Scan

        run: dotnet sonarscanner end /d:sonar.token="${{ secrets.SONAR_TOKEN }}"
Pull request decoration: The "killer feature"
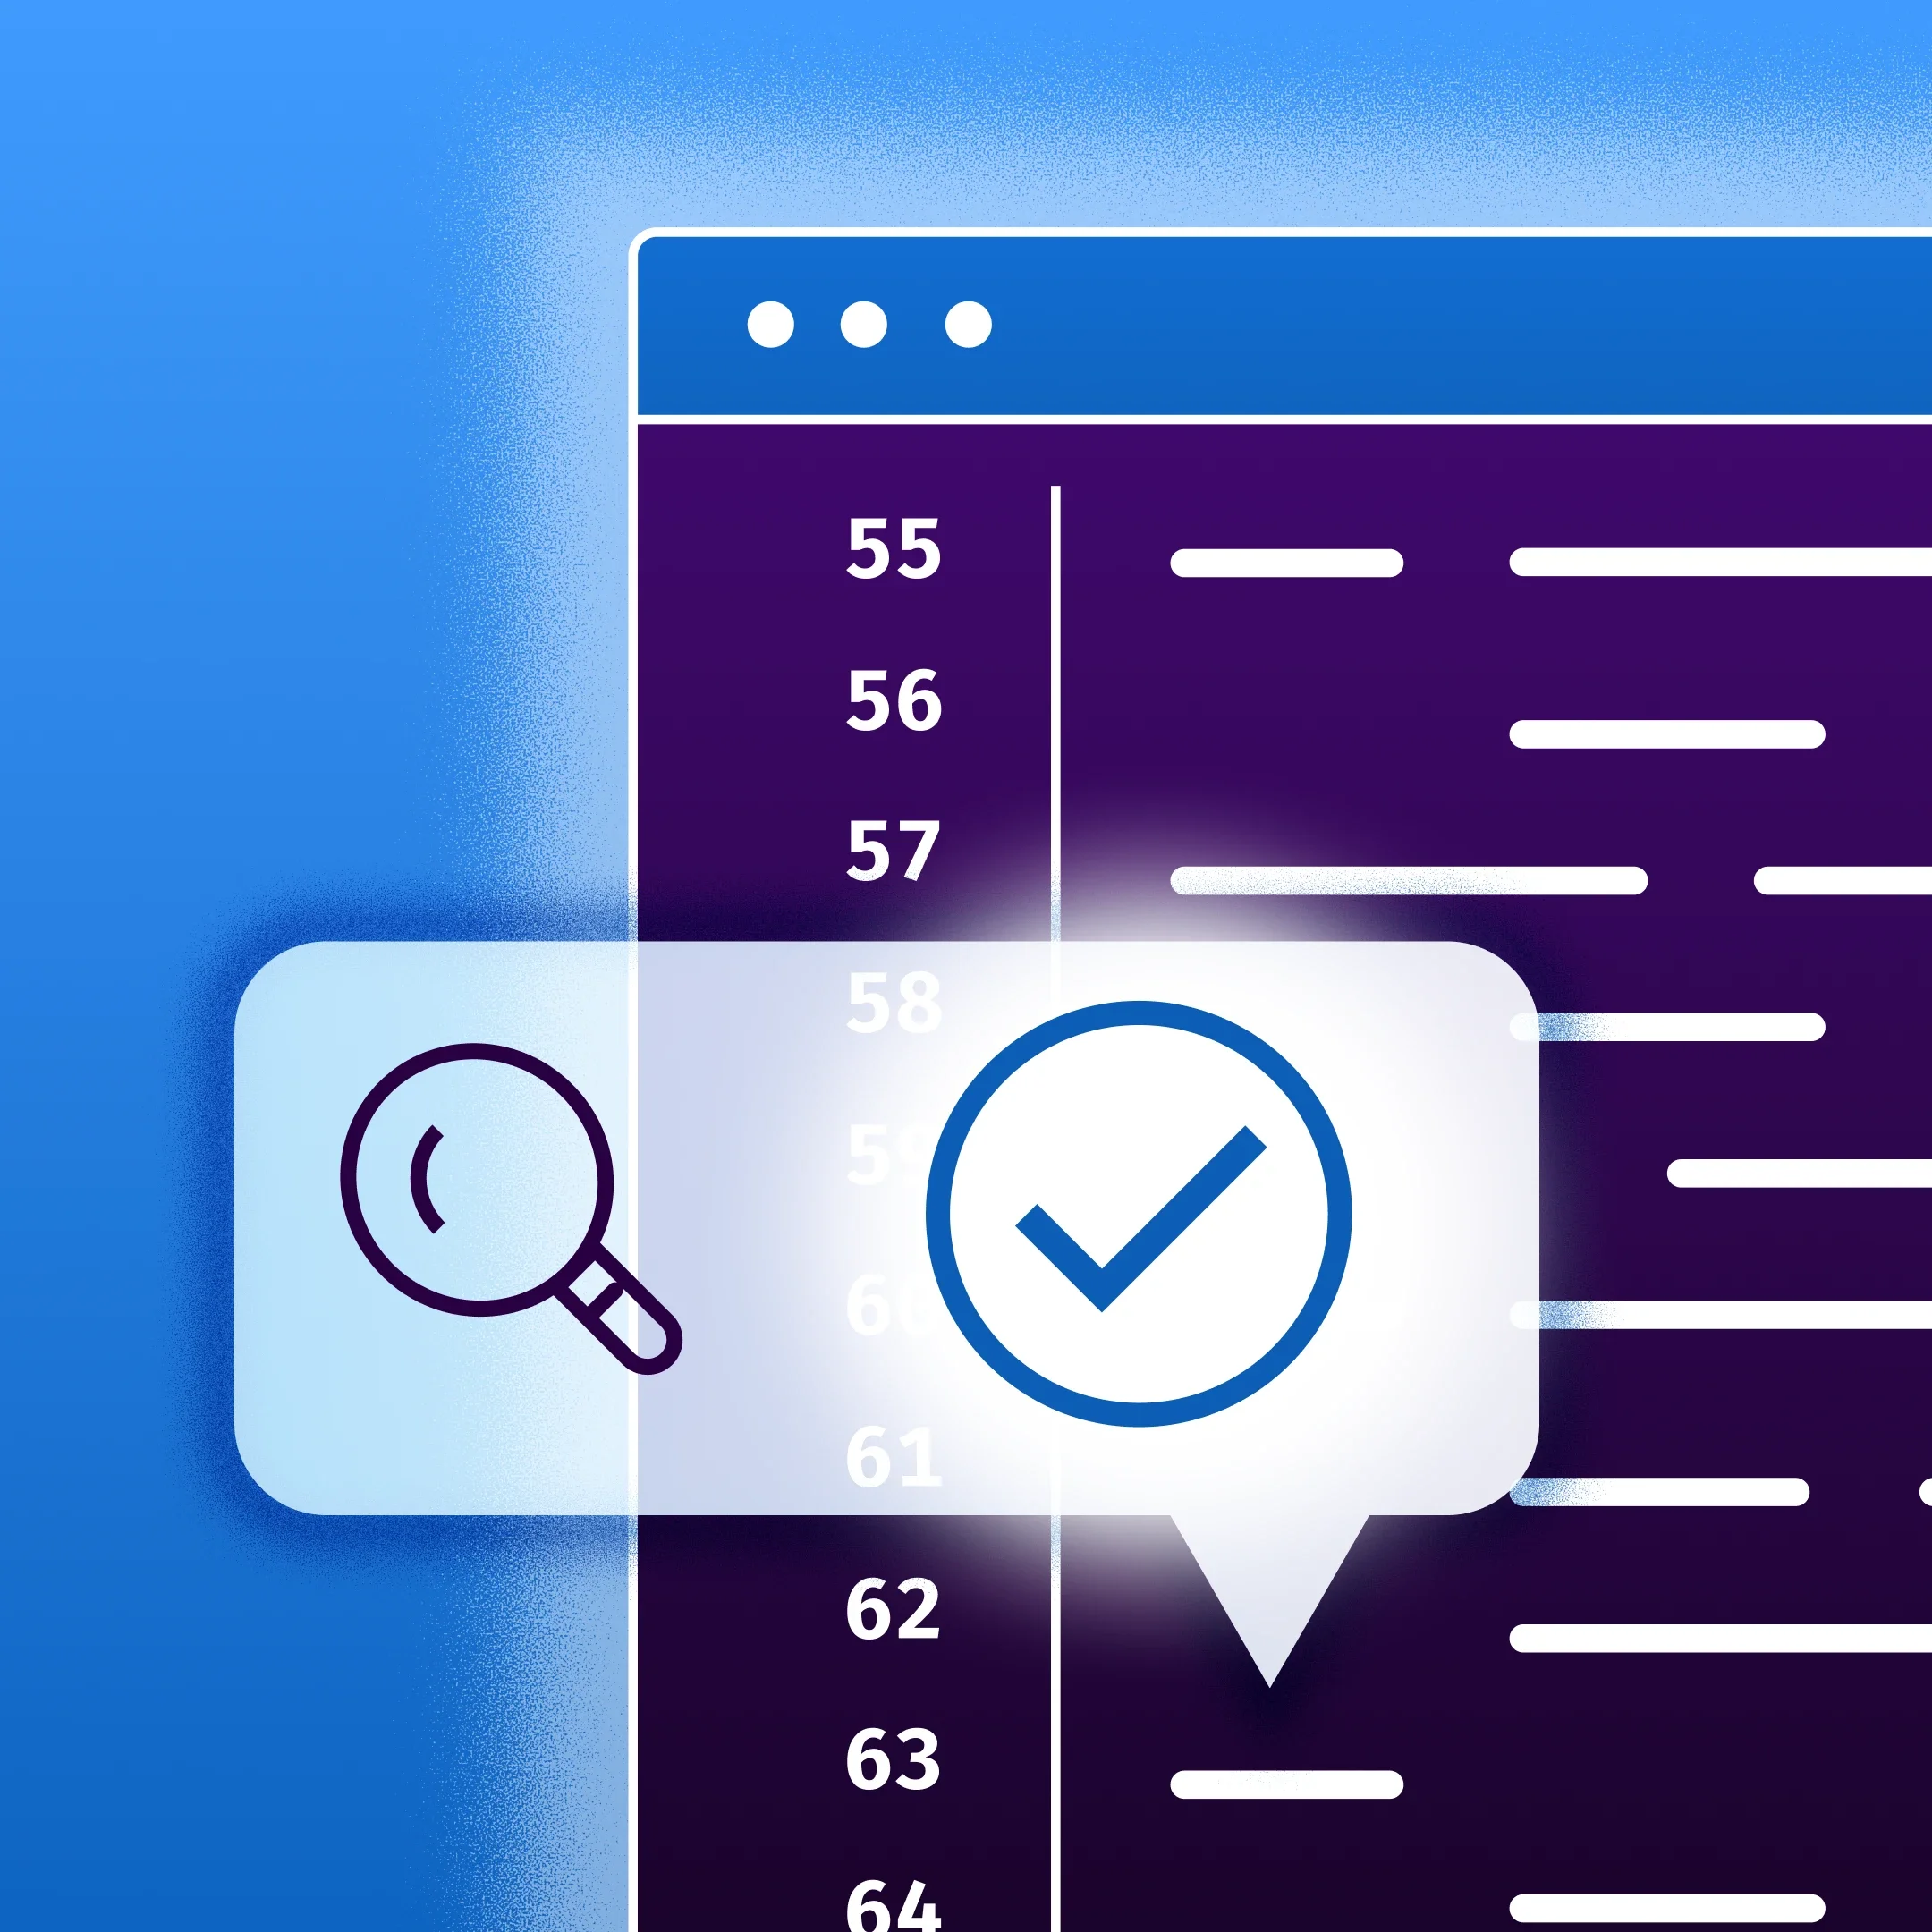
While failing a build pipeline is effective, it forces the developer to context-switch and check CI logs to understand why it failed. Pull Request (PR) Decoration bridges this gap by injecting feedback directly into the code review interface.
When configured, SonarQube Cloud detects that an analysis is running for a Pull Request. It calculates metrics specifically for the New Code (the changes in the PR) and posts comments on the specific lines of code that introduced issues.
Visualizing the Impact: Instead of a generic "Build Failed" error, the developer sees a comment directly in the GitHub or Azure DevOps PR view:
SonarQube Cloud: Reliability Rating on New Code is D. A null pointer dereference was detected on line 42.
Enabling decoration
For SonarQube Cloud, this is often automatic if you import the project via the UI. If not, ensure the following:
- Azure DevOps: Ensure your Service Connection is valid and the Personal Access Token (PAT) used has "Code (Read & Write)" permissions.
- GitHub: Ensure the SonarQube Cloud GitHub App is installed on your organization and has access to the repository.
Automating quality conclusion
By implementing these pipelines, you have transformed code quality from a manual "check" into an automated gatekeeper. Every commit is now verified against your organization's standards, ensuring that technical debt is identified and resolved before it ever reaches the main branch.
In Part 4, we will examine the data these pipelines produce. We will provide a comprehensive guide to interpreting the SonarQube Cloud dashboard, distinguishing between "New Code" and "Overall Code" metrics, and tailoring Quality Gates to fit your team’s maturity level.