TL;DR overview
- Debugging is the process of tracking down and eliminating issues such as bugs and vulnerabilities that arise from bad coding, architecture, or implementation.
- Common debugging approaches include tracing tools, logging instrumentation, unit testing, and static code analysis.
- Finding and fixing issues as early as possible in the development lifecycle reduces the cost and effort of remediation.
- SonarQube for IDE performs static code analysis directly in the IDE, catching issues at the point of code creation before they require debugging.
What is Debugging?
Debugging is the process of tracking down and eliminating issues in software applications such as bugs and vulnerabilities that may arise due to bad coding, architecture, or implementation. It is commonly associated with the use of tracing and analysis tools that can execute our code step-by-step and allow us to examine the program state while suspended.
Debugging can also be achieved in many other ways, including instrumenting our code to produce extra artifacts, such as logging, executing in small, controlled, units (testing), or examining the code statically (code review and static analysis).
We’ll look at some of the tools and techniques later in this article.
However you do it, once you have tracked down the root cause, the next job is to correct the code and fix the bug.
The fix should then be tested to verify it is really fixed (this could be by just repeating the same debugging steps that isolated it in the first place).
Ideally, we should find and fix code issues as the code is getting written in the Integrated Development Environments (IDEs).
This is where a free linter tool in the IDE, like SonarQube for IDE, can help by performing static code analysis to highlight and fix code quality and security issues quickly and easily.
Why is debugging important?
Debugging is a crucial component of software development since bugs can make a program or system fail, result in poor performance, or even inaccurate measurements and results. The debugging process can be time-intensive and be divided into several complex iterative processes to identify and correct the errors in the code.
However, it is vital to ensure the system and program operate properly.
Preferably, software should work as designed and contain no bugs before the latest update is released into the market all while maintaining the highest quality of code and performance.
Our world runs on software and source code.
Every company has now become a technology company with its own tech stack.
In order to remain competitive, each company needs to remain top of mind and give top-level experiences.
Buggy or problematic code results in a poor user experience which reflects poorly on the business and discourages users.
In the scope of debugging, it is important to establish a definitive process for tracking and communicating bugs so they may be successfully managed and fixed.
How does debugging work?
Code and software debugging involves identifying and resolving issues, errors, or unexpected behaviors within a program to ensure it functions as intended. It is a crucial part of software development, ensuring the reliability, functionality, and quality of the final product.
Debugging begins with identifying symptoms, such as program crashes, unexpected outputs, or erroneous behavior.
Developers often use build and run time tools to pinpoint where the issue might lie.
Once the symptom is recognized, developers try to isolate the specific code section or component causing the problem.
Various debugging tools, such as linters in IDEs, debuggers, logging mechanisms, or specialized software, help developers inspect variables, step through code, and identify issues at different levels.
Code debugging commonly works by gradually stepping through the execution of your code until you find the point where the bug occurs. From there, you should start working on how to fix the code.
How a code debugger works will vary based on what you are debugging, the language, and the system used.
Identifying bugs can be made easier by looking at the code’s logging and using standalone debugger tools or a debug mode within an IDE.
What are debugging tools and software?
Debugging tools are software programs that are used to identify, test, and debug issues by other programs. These tools provide a systematic approach to troubleshooting and debugging software, providing detailed information about the program's execution, memory usage, variables, and other relevant data.
This allows the programmer to watch the implementation and view the changes occurring which may manifest in the code failing.
Debuggers
Debuggers are distinct tools that give developers the ability to watch and control how their program is being run. A debugger lets you set a breakpoint in your code, normally by highlighting a line of code, then when the application runs in debug mode the debugger can intercept the program and halt execution.
Once execution has stopped you can inspect the values of variables at that point and then advance through the code step-by-step monitoring the program's state until you discover where the bug is.
Additionally, debuggers provide features that help programmers track down and comprehend the execution of code as well as pinpoint the root causes of unusual behavior or failures.
While there are standalone debuggers available, some IDEs, like Visual Studio, include built-in debuggers.
Some common interactive debuggers include:
- GDB (GNU Debugger)
- LLDB (Low-Level Debugger)
- WinDbg (Windows Debugger)
- Visual Studio Debugger
- IntelliJ IDEA Debugger
- PyCharm Debugger
Profilers
By calculating the execution time and resource consumption of their code, profilers assist developers in analyzing the overall performance of their code and pinpointing any potential bottlenecks. They offer information on performance-related indicators such as function call frequency, memory allocation, and CPU use.
Developers can improve their programs by identifying the specific lines of code that are using too many resources or running slowly by using profilers.
Java, .NET, and C++ profilers are commonly used to identify performance bottlenecks and optimize the applications.
Logging and Tracing Tools
Logging tools examine, record, and review particular events, messages, and errors that take place during program execution. To produce logs or traces for debugging, you may need to instrument your code.
This means adding code to your program to record events and write them to a log or trace file.
They record crucial data on the behavior and state of the program, which can later be evaluated to find and address problems.
Tracing software takes it a step further by offering a thorough record of the program's execution sequence, complete with function calls, inputs, and outputs.
Diagnoses of complicated or recurrent problems can be made with the help of these techniques.
This is usually done to try to track down an issue in production that is hard to reproduce locally.
It isn't interactive and relies on observing the data after the fact to try to recreate the context of a bug.
Memory Debuggers
Memory debuggers assist in identifying and resolving the memory usage of a program while it is running and they can detect a variety of memory errors, including memory leaks, buffer overflows and memory corruption.
- Memory leaks are when a program allocates memory but fails to deallocate (redistributing memory back to the system to be used elsewhere) which leads to a gradual reduction in the available memory over time.
- A buffer overflow occurs when data exceeds the boundaries of a buffer, potentially overwriting other memory locations that may lead to unpredictable behavior or security vulnerabilities.
- Memory corruption refers to a scenario where a program erroneously alters the memory locations due mainly to bugs which can result in erratic program behavior or crashes.
Memory debuggers keep track of memory allocations and deallocations, spot erroneous memory accesses, and offer data on consumption trends.
Memory debuggers are often necessary for avoiding crashes, enhancing performance, and guaranteeing the effective use of system resources.
Code Analysis Tools
Code analysis tools, such as static analysis tools, examine source code to find possible problems, vulnerabilities, or violations of good programming principles.
These tools automatically inspect code for issues based on predefined rulesets or custom configurations, providing developers with valuable insights and feedback to improve code quality, maintainability, and adherence to coding standards.
Static analysis is done by looking for patterns in the code that could result in bugs or security flaws.
Code analysis tools can help programmers produce Code Quality which is more dependable code by spotting typical programming problems.
Unit Testing Frameworks
Unit testing frameworks can help with debugging even though they are often used for testing. They give programmers the ability to create and run automated tests that isolate particular areas of the software.
Unit testing frameworks can help in determining the root cause of mistakes or unexpected behaviors by offering thorough test results and failure data.
If you can write a unit test that fails because of the bug, then once the test passes you can be confident that the bug is fixed. This is still testing but as a facet of debugging.
There are numerous unit testing frameworks that are accessible to developers.
The programming language, development environment, and particular debugging requirements all influence the tool selection.
Writing effective tests improves the chances of locating and resolving bugs.
What are the types of debugging techniques?
Print Debugging
Print debugging is the simplest form of debugging and the first one that most developers learn. It is a technique for debugging software by inserting print statements into the code to display the values of variables and the state of the program at certain points in its execution.
This information can then be used to identify the source of errors and to fix them.
Print debugging is a simple and effective way to debug software, but it can be time-consuming and inefficient.
It is important to use print debugging sparingly and to remove the print statements once the errors have been fixed.
Remote Debugging
Remote debugging is a process where debugging is performed on a system different from where the debugger is located. This is essential in scenarios where the problem is reproducible only on a remote machine or a specific environment.
Implementing remote debugging can be done in numerous ways. Typical techniques include:
- Using a debugger that is integrated into an IDE: Many IDEs feature built-in debuggers that support remote debugging, including Visual Studio and Eclipse.
- Using a standalone debugger: Tools like GDB and LLDB are examples of standalone debuggers that offer remote debugging.
- Using a language-specific debugger: Some languages provide debuggers that facilitate remote debugging, such as Python and Ruby.
The debugger normally must be installed on both the computer that the program or process is running on as well as the computer that the debugger is running on in order to set up remote debugging.
Additionally, you might need to set both computers' firewalls to accept the debugger, to communicate with the remote program or process.
Once remote debugging is enabled, you can use the debugger to debug the program or process as if it were executing on the same machine as the debugger.
Breakpoints can be set, code can be stepped through, variables can be examined, and so on.
Remote debugging is a useful tool for debugging a wide range of programs and processes.
Notably, it is useful for debugging applications and processes running on remote servers or on difficult-to-access hardware.
Post-Mortem Debugging
Post-mortem debugging is the process of fixing a program after a crash. Many tracing methods, such as looking through log files, printing the call stack of the crash, and analyzing the memory “core” dump of the failed process, are frequently related techniques.
The system, a programmer-inserted command, an interactive user, or the system itself may automatically get the process dump (for instance, when the process has ended owing to an unhandled exception).
Tools include dbx, gbd, and Python Post-Mortem Debugger.
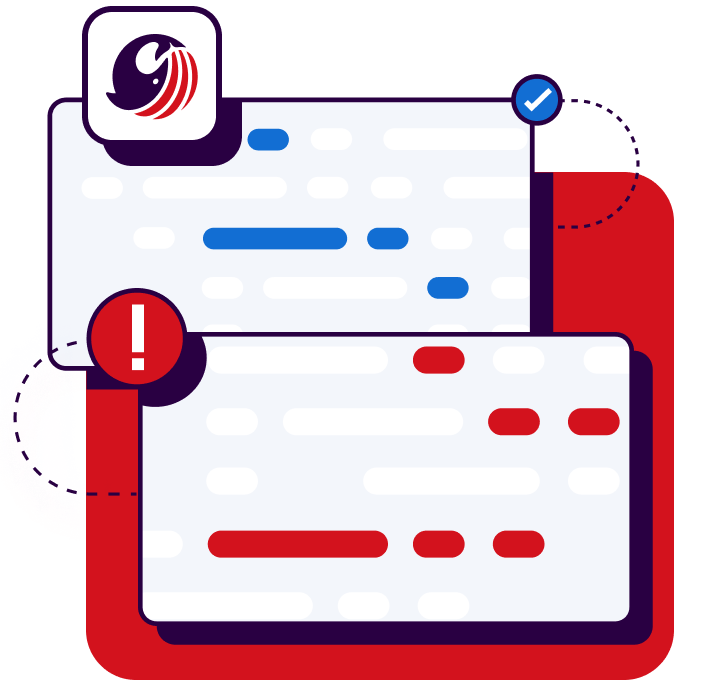
Sonar and Debugging
Debugging, especially someone else’s code, can be incredibly time-consuming and difficult.
For those dealing with problems in code, there are a variety of tools out there to assist you on this journey, whether that is dealing with someone else’s code or your own. You may need to look around and test what works best for you.
Using a Code Quality process can help avoid bugs in the first place and make debugging easier for future programmers who will have to interact with your code.
At Sonar, we provide substantial benefits to the debugging process by identifying, analyzing and fixing issues following establishing coding standards while offering in-depth code analysis for a wide range of programming languages and frameworks.
Sonar provides issue prioritization that gives insight into what is more likely to cause problems, enabling developers to focus their debugging efforts on the most critical points first.
How Sonar can be used to improve debugging
Sonar can be used to detect potential issues early in the development process.
Using a powerful static analysis engine, Sonar solutions automatically examine code and detect coding issues such as bugs and vulnerabilities.
SonarQube Server and SonarQube Cloud natively integrate into your CI/CD pipelines to find and fix bugs early in the development phase before they create difficulties in production.
SonarQube for IDE, a companion tool to SonarQube Server and SonarQube Cloud, offers IDE integrations. It can provide real-time feedback within the developer's IDE, highlighting code issues as developers write code.
Addressing these issues proactively can prevent potential bugs and reduce the need for extensive debugging later.
While Sonar products don't directly replace traditional debuggers, they play a crucial role in proactive code analysis and quality management.
By identifying potential issues early in the development cycle, they contribute to reducing the likelihood of bugs and issues that would require extensive debugging efforts.
Using solutions such as Sonar, which integrates with Source Code Management (SCM) and CI/CD toolchains, helps improve collaboration and communication on debugging tasks with other co-workers or teams allowing multiple developers to find and fix complex bugs.
Reduce risks by eliminating bugs early in the development process to ensure software functions well in production.