
Table of contents
 Problem 1: configuration drift between local and server environments
- Problem 2: detecting complex injection vulnerabilities
- Problem 3: context switching to debug build failures
- Problem 4: managing legacy code and quality gates
- Problem 5: managing false positives and exceptions
- Problem 6: monitoring project health
- Automating analysis with Maven and GitHub Actions
Start your free trial
Verify all code. Find and fix issues faster with SonarQube.
CommencerIn the previous guide, we covered the installation of SonarQube for IDE to catch issues locally. Now, we move from individual contributions to team collaboration. When working in a team environment, code is pushed to a shared repository containing specific configurations, DTOs, and services.
A common friction point in software development occurs when code passes local tests but fails within the CI/CD pipeline. This often happens due to configuration drift—where local plugin rules differ from the quality profile defined on the server.
This guide covers how to automate analysis and synchronize your local environment with your team's standards using Connected Mode. This ensures your quality gate protects the codebase without becoming a burden on velocity.
Problem 1: configuration drift between local and server environments
You may encounter a scenario where your local environment allows specific coding patterns, such as field injection (@Autowired on a private field), but the server’s quality profile blocks them in favor of constructor injection to ensure testability.
The solution: Connected Mode
When you bind your Java project to SonarQube Cloud or SonarQube Server using Connected Mode, your IDE stops using default local rules. Instead, it downloads the exact configuration from the server. If your team lead enables a rule to ban field injection, SonarQube for IDE will immediately highlight the issue locally. This alignment prevents surprises in the pipeline.
How to configure Connected Mode in IntelliJ
- Open settings: Navigate to IntelliJ Settings (or Preferences) > Tools > SonarQube for IDE.

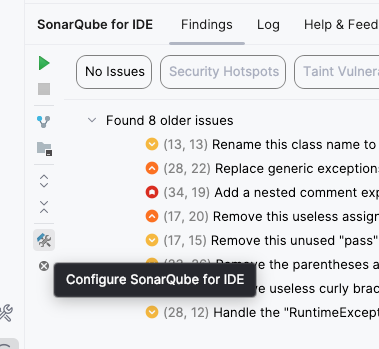

- Add connection: Click the + icon under "Connections."

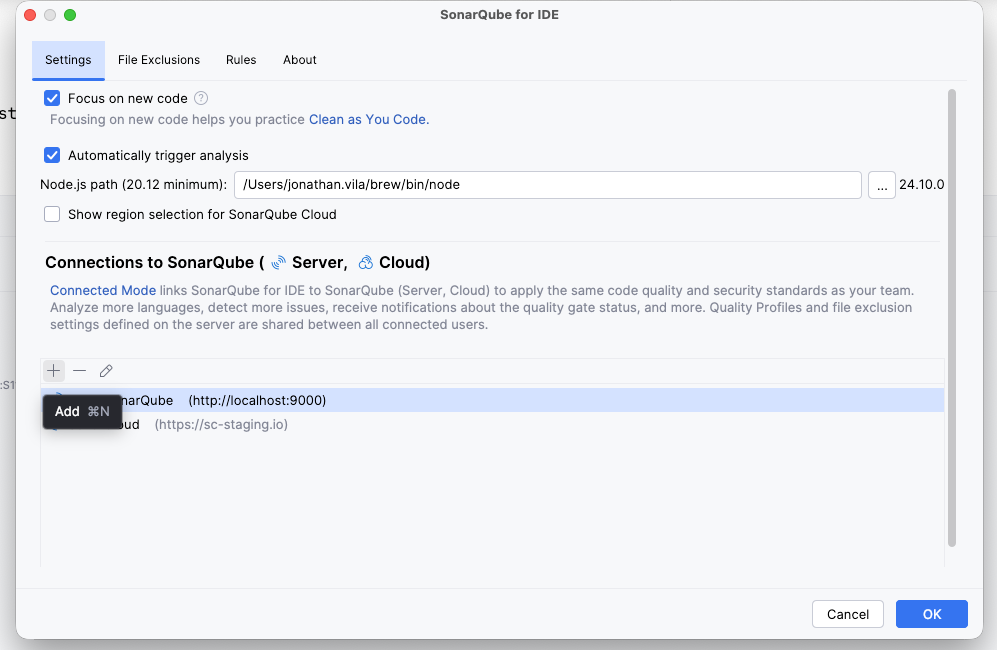
- Select platform: Name your connection (e.g., "SonarQube Cloud") and select the appropriate connection type.

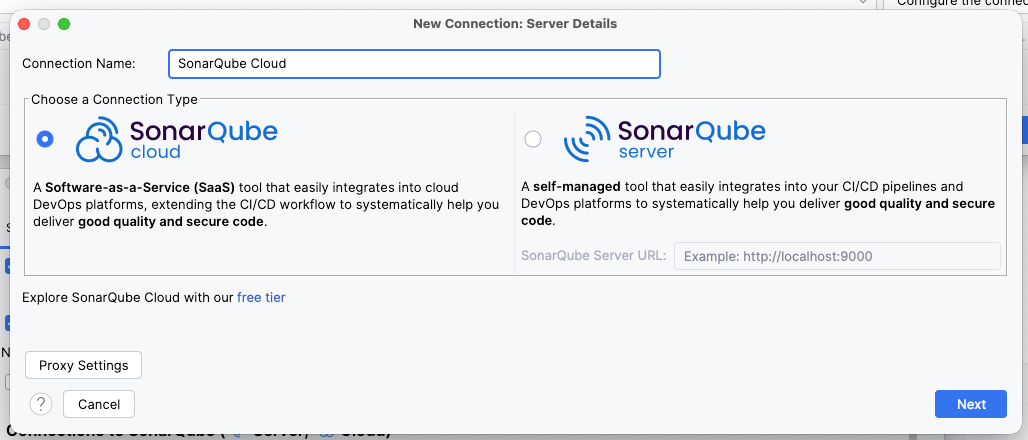
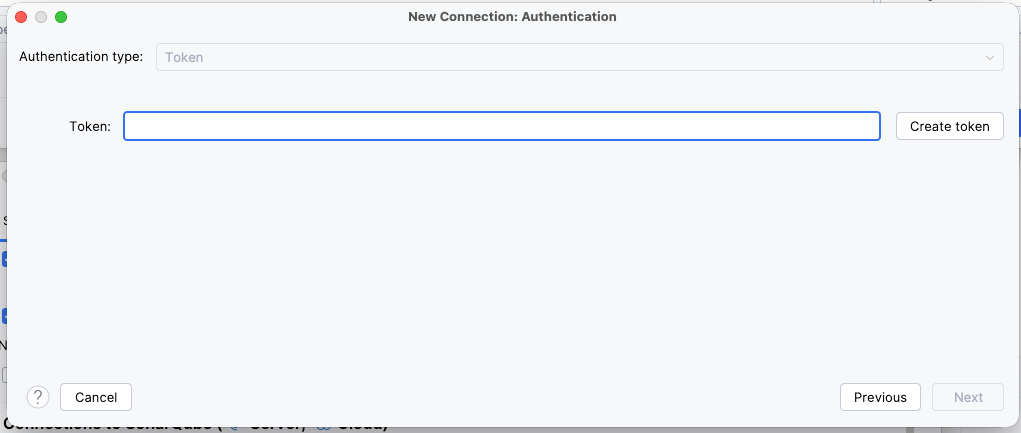
- Authenticate: Click Create Token. This will open your browser to generate a token. Copy it back into IntelliJ.

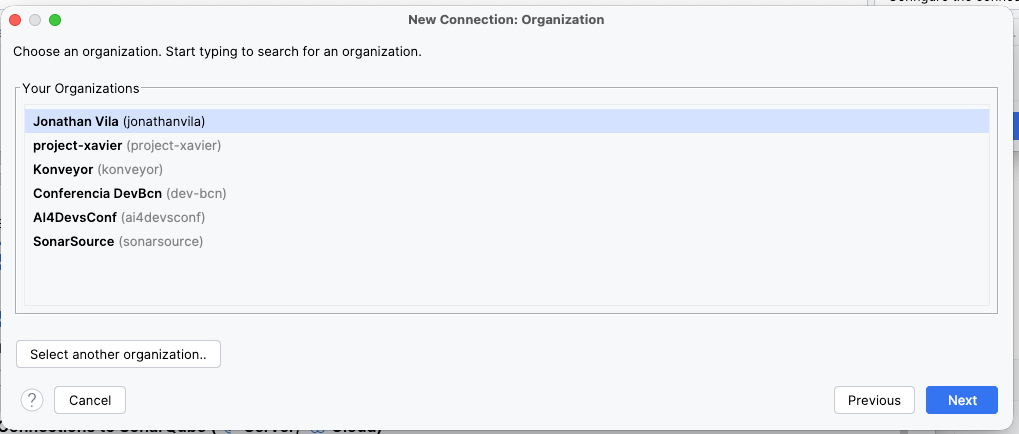
- Select organization: Choose your organization from the list.

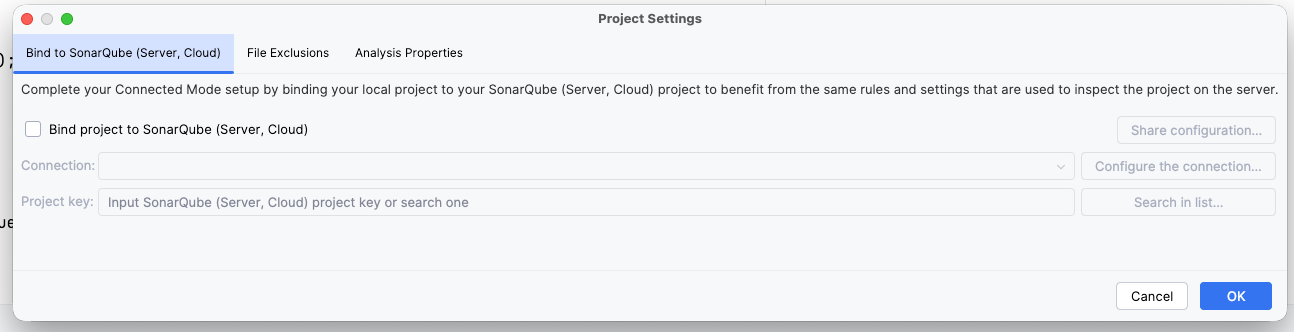
- Bind project: Once the connection is established, check the Bind project toggle. Search for your specific project key (e.g.,
my-company_backend-api) and select it.

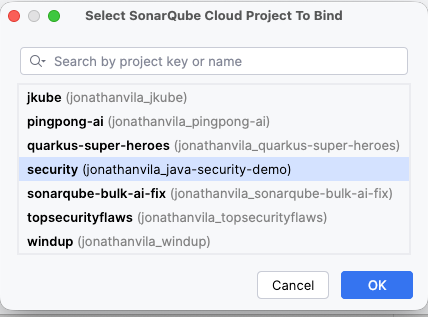

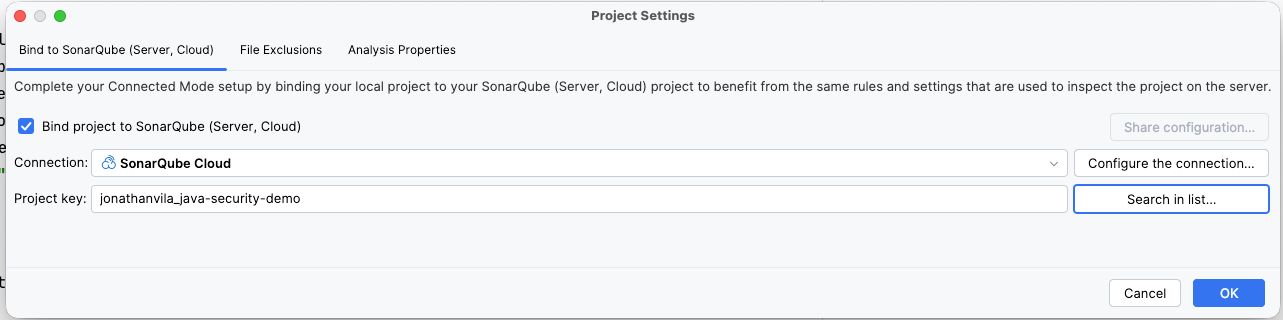
You will receive a notification stating "Project bound successfully." Your local analysis is now synced with your server's quality profile.
Problem 2: detecting complex injection vulnerabilities
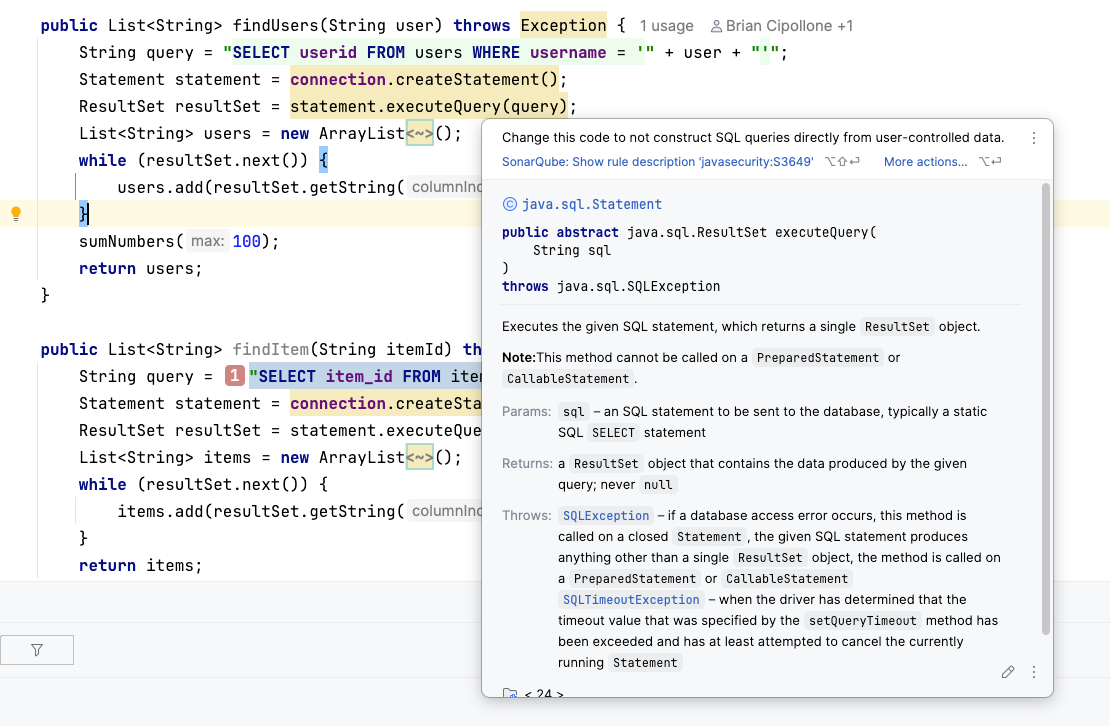
While SonarQube for IDE is powerful, certain complex issues require a broader view of the application. For example, a SQL injection vulnerability might involve data traveling from a controller, through a service, and into a repository. Tracing this path requires taint analysis.
To maintain local performance and prevent the IDE from freezing, heavy taint analysis is performed by the SonarQube engine (Server or Cloud) rather than the local plugin.
The solution: balancing speed and depth
- SonarQube for IDE: Catches logic errors, code smells, and local bugs instantly as you type.
- SonarQube Server/Cloud: Performs deep analysis, including taint analysis, to detect complex security risks where untrusted input reaches sensitive sinks.

Problem 3: context switching to debug build failures
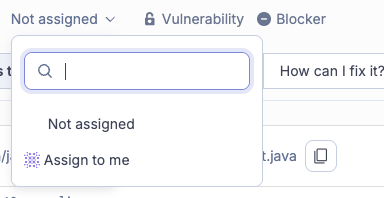
If a build fails, developers traditionally have to leave their workflow, log in to a dashboard, find the project, and locate the specific branch to understand the error.
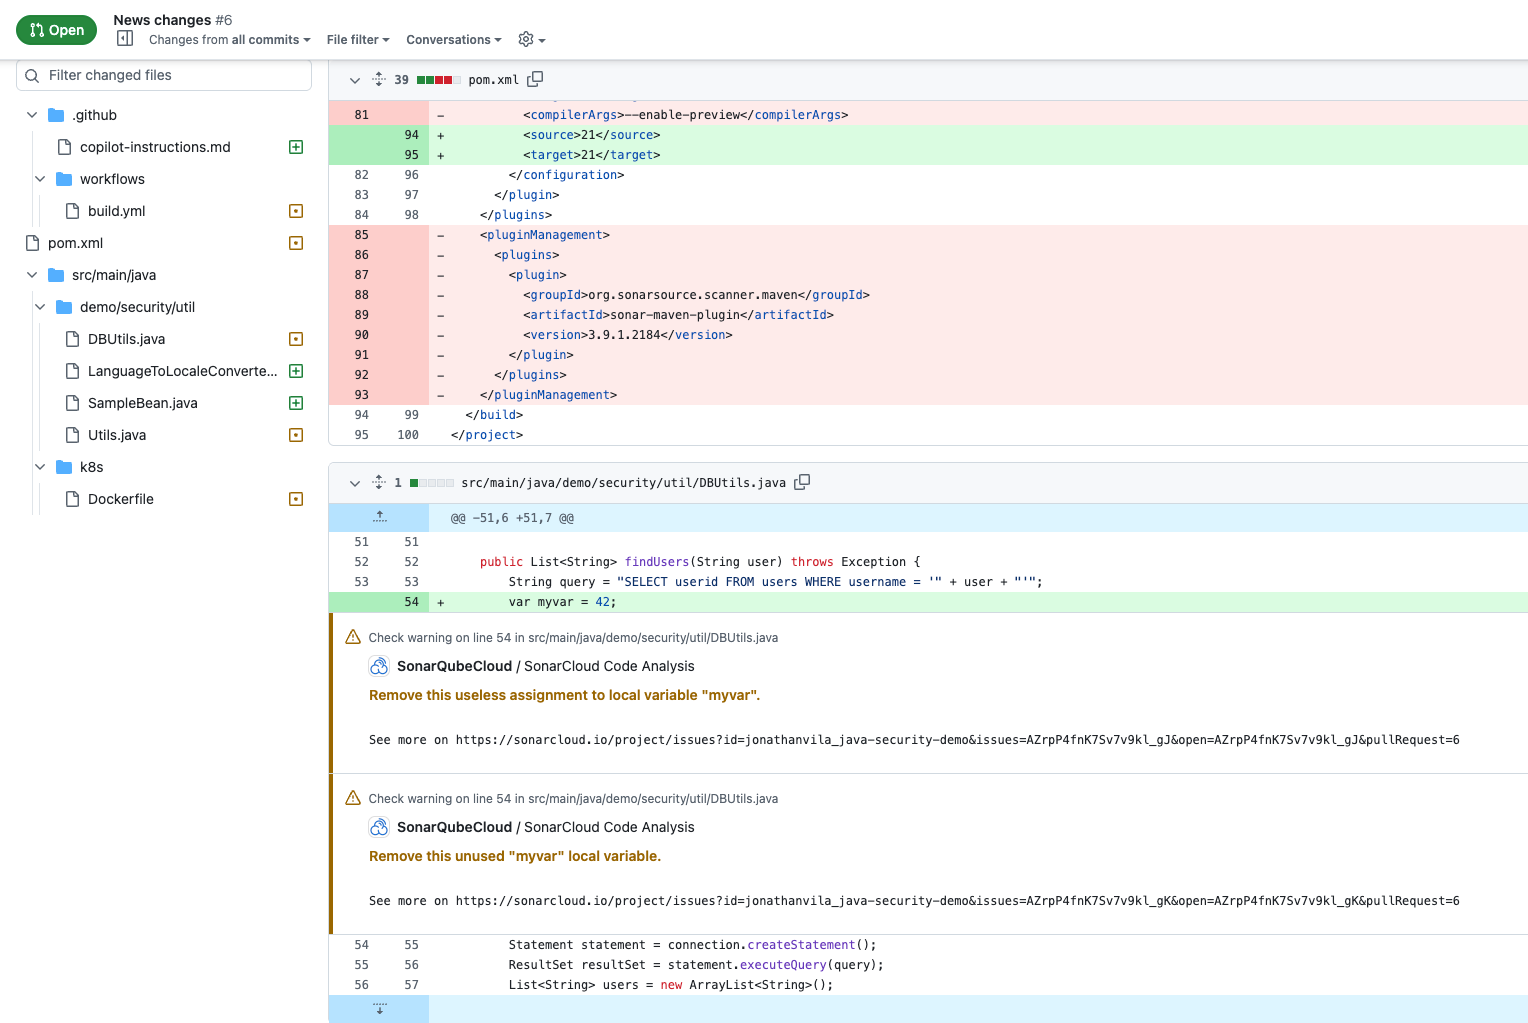
The solution: pull request decoration
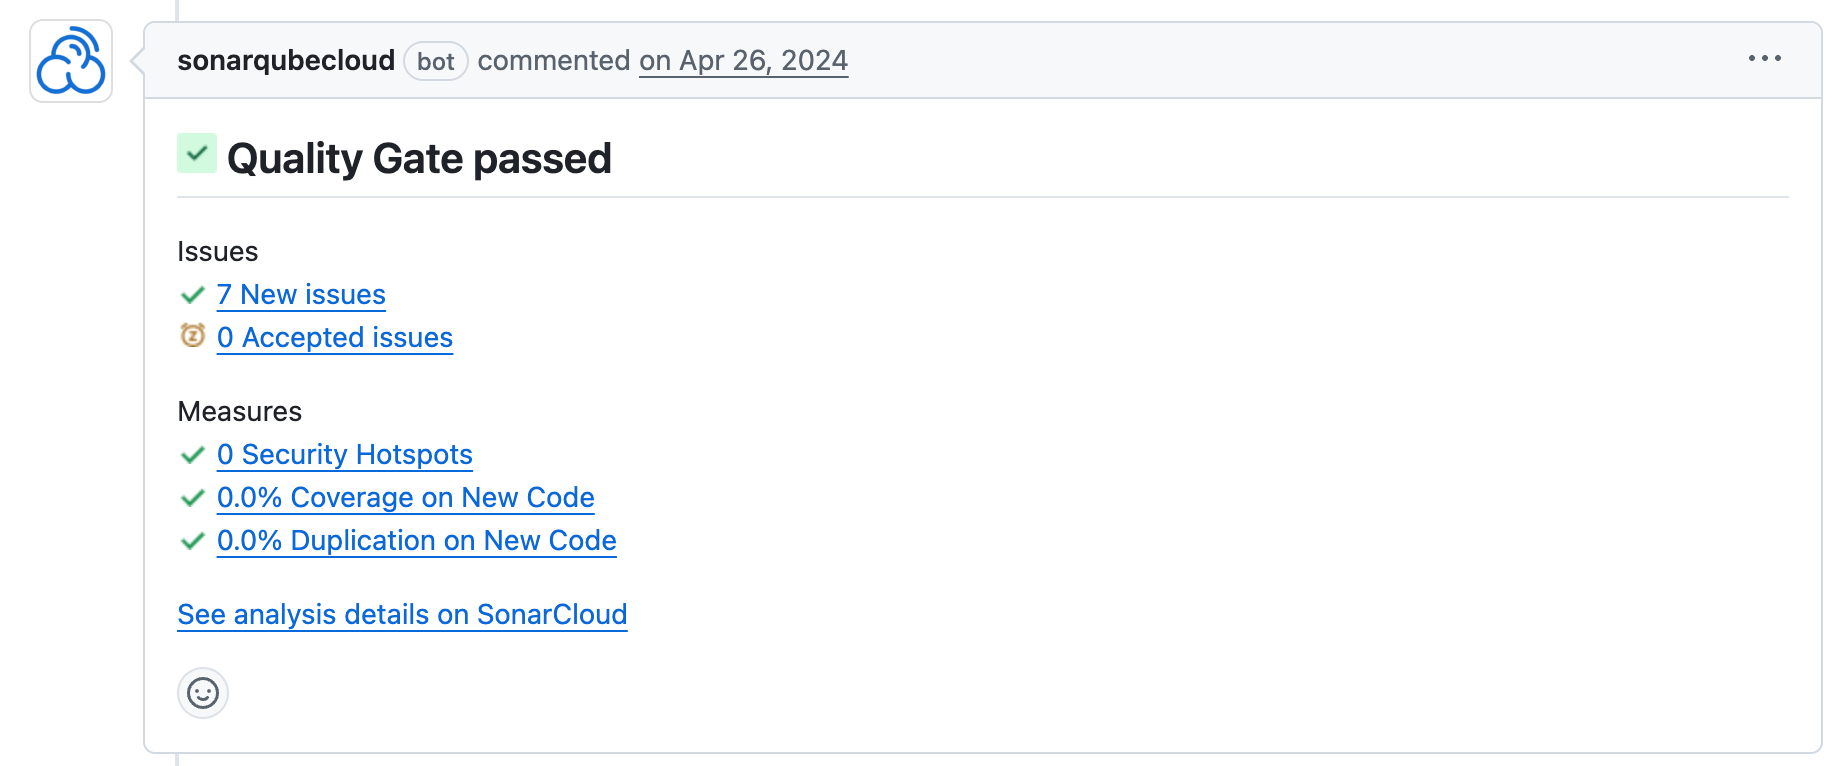
When using SonarQube Cloud or SonarQube Server, the platform integrates directly with your git provider (GitHub, GitLab, Azure DevOps, or Bitbucket). If the quality gate fails, SonarQube posts a comment directly on the specific line of code in the pull request. This provides immediate, actionable feedback within the existing review conversation.


Problem 4: managing legacy code and quality gates
A common concern is that strict quality gates will block development on legacy applications that have low test coverage or high technical debt.
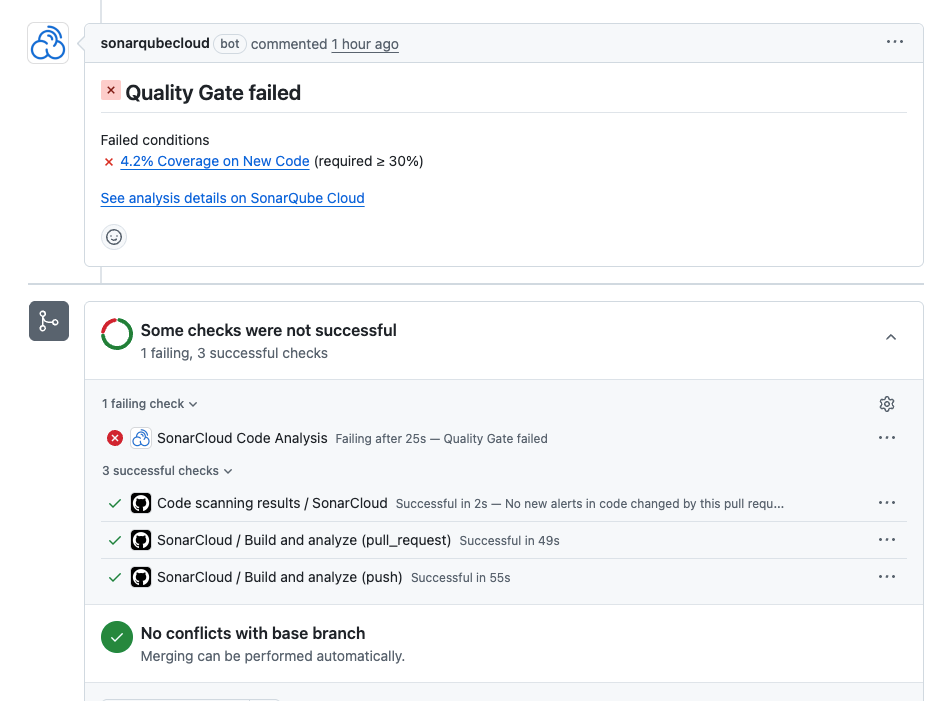
The solution: focus on new code
SonarQube allows you to customize the quality gate to focus specifically on "New Code." This methodology allows you to improve code quality as you write, without being blocked by preexisting debt.
- Configuration: Set your quality gate condition to check "Coverage on New Code > 80%."
- Result: You can merge changes as long as your specific contribution is tested and with high quality, regardless of the state of the legacy codebase.
Customizing quality profiles
Your team can clone the default "Sonar way" profile and modify it to fit your specific needs. For example, if your team does not strictly adhere to specific naming conventions or trailing comment rules, these can be disabled in your custom profile to reduce noise.

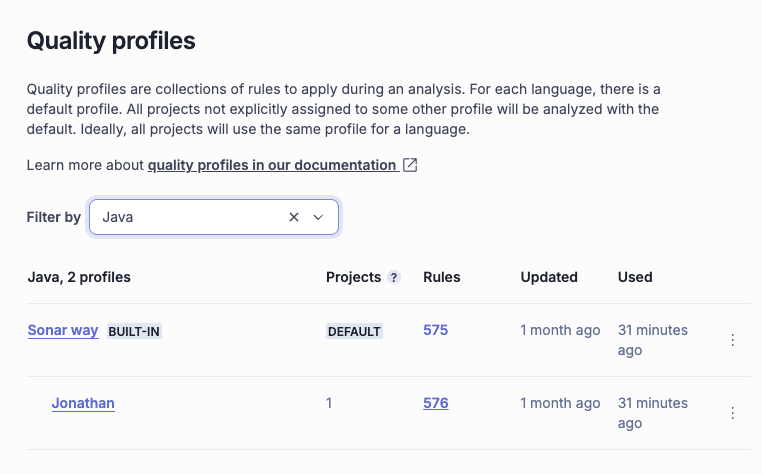
Inherit the Sonar way Quality Profile and customize it

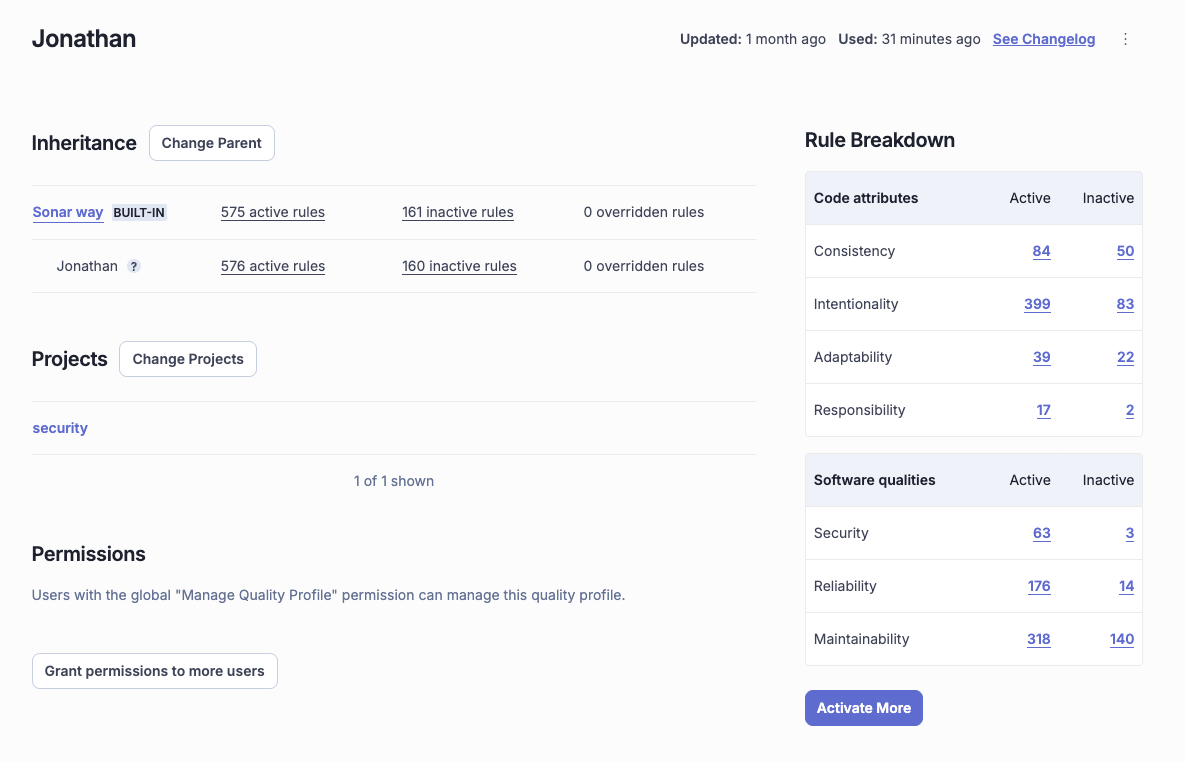
You can see there’s one difference between the default Quality Profile and the one we created

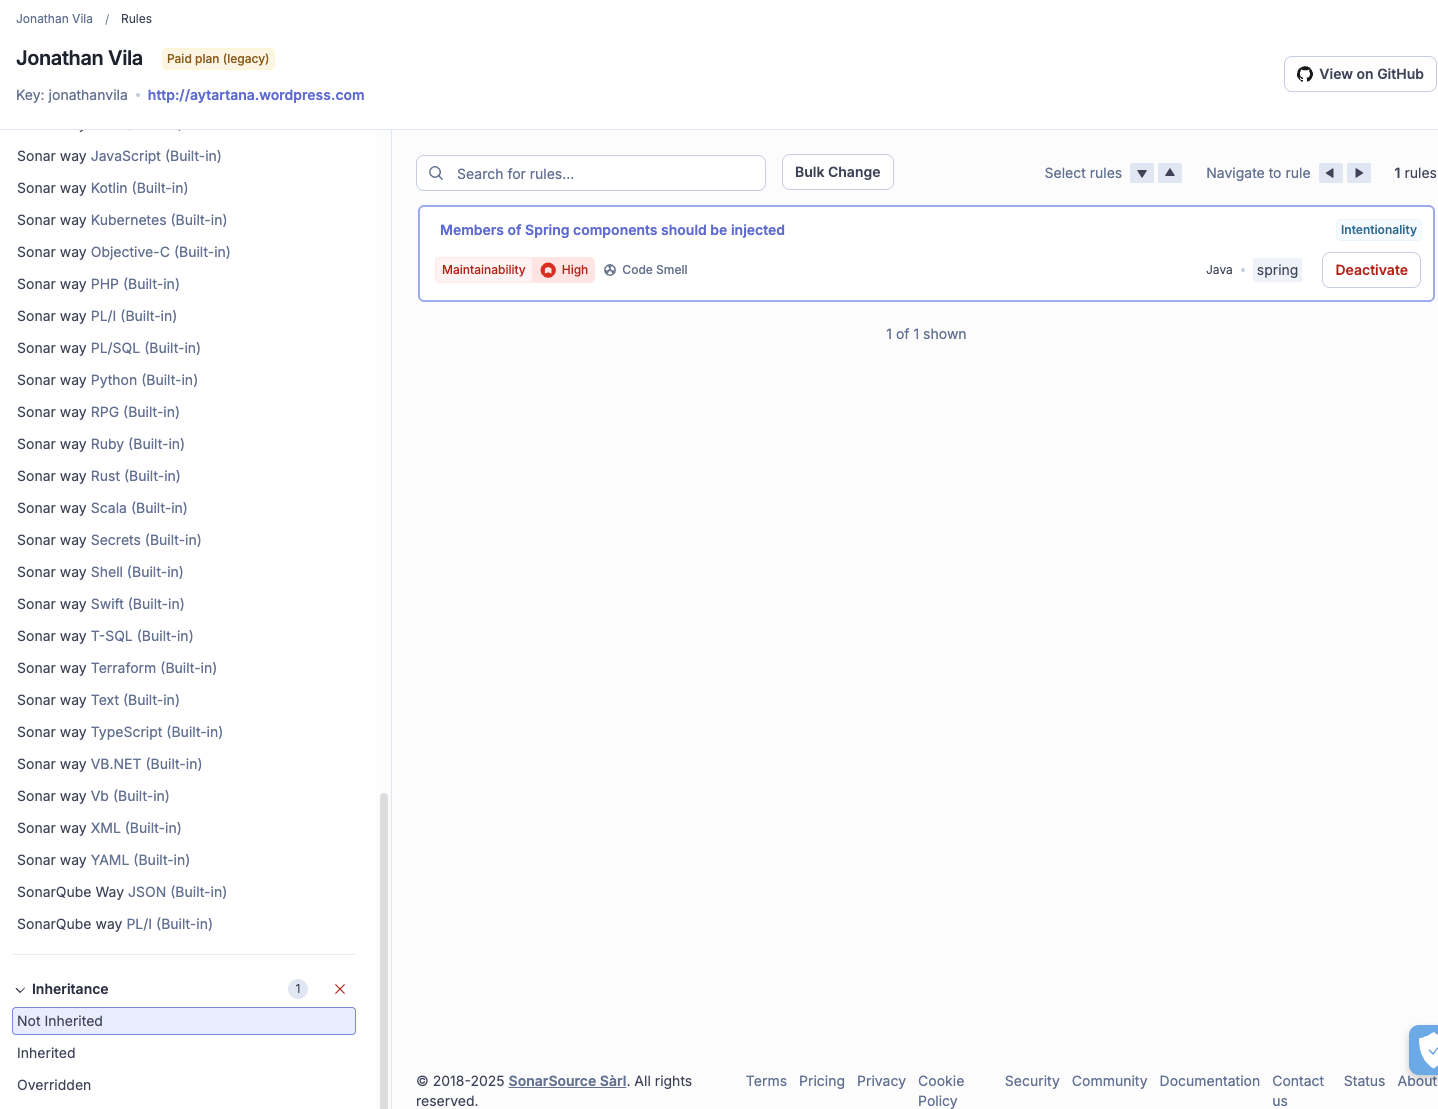
See the particular changes done in the new Quality Profile

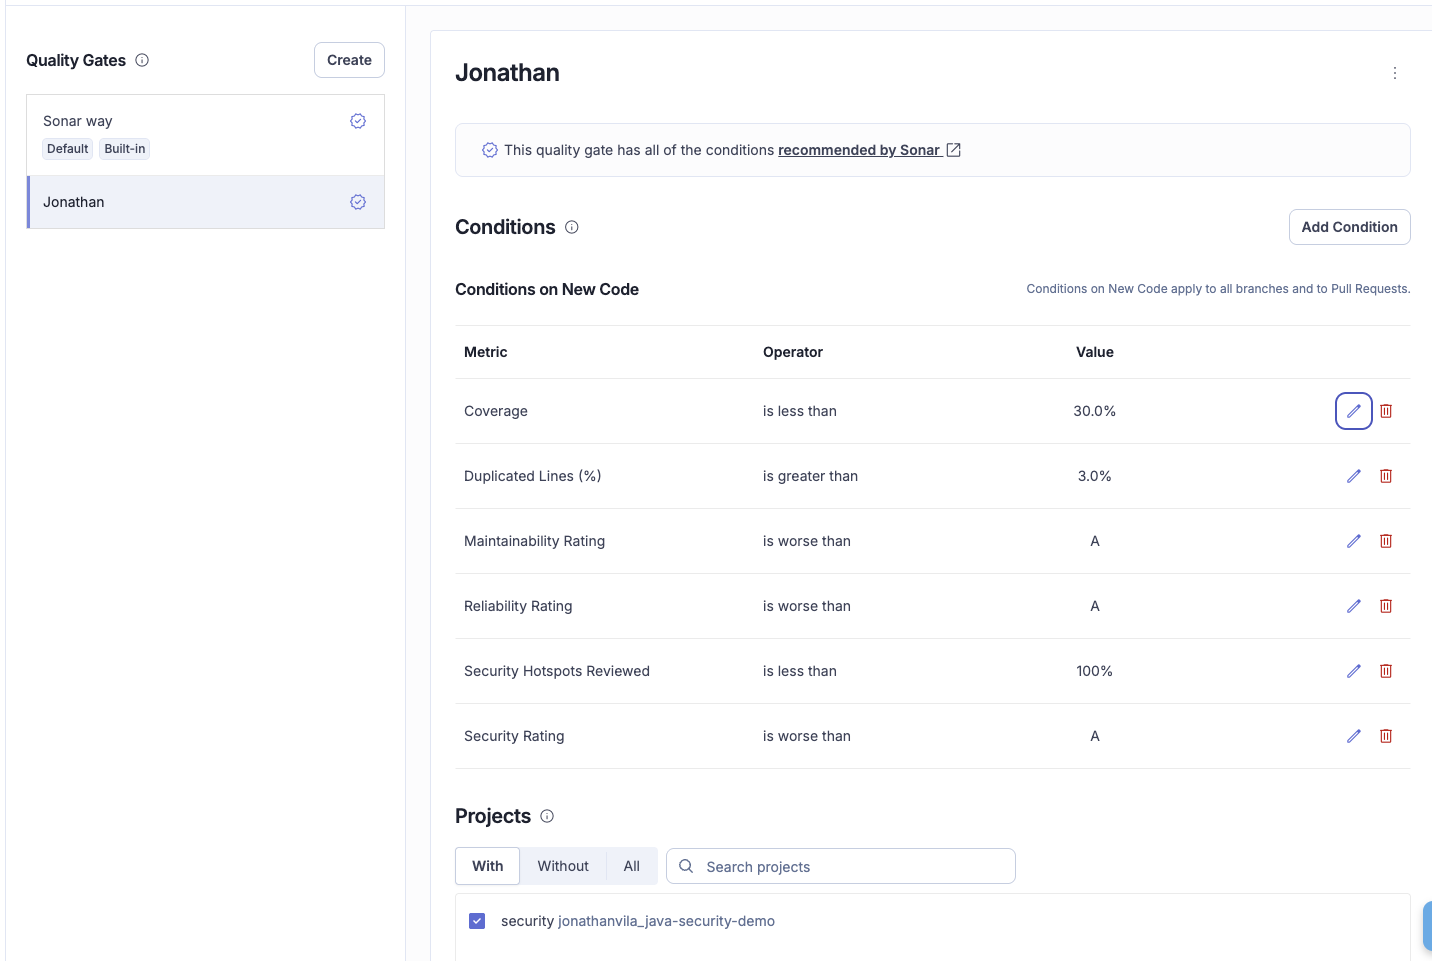
Change the parameters that will impact in the Quality Gate
Problem 5: managing false positives and exceptions
General rules apply to most scenarios, but there are exceptions. For example, a hardcoded password in a test utility class may be acceptable, even if it flags a security rule.
The solution: issue lifecycle management
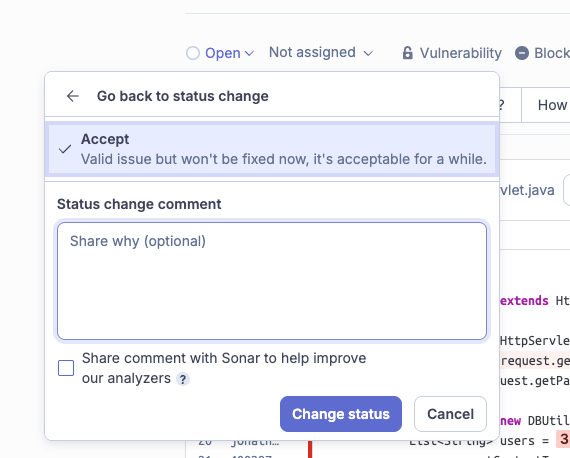
If a quality gate blocks a merge due to a context-specific issue, you can override the tool’s judgment in the SonarQube UI:
- Accept (Won’t fix): Use this when you acknowledge the issue but determine the implementation is correct for the specific business case (e.g., a specific algorithm requirement).
- False positive: Use this when the analyzer has misinterpreted the code context (e.g., a variable that is validated by a framework annotation unseen by the static analyzer).


Problem 6: monitoring project health
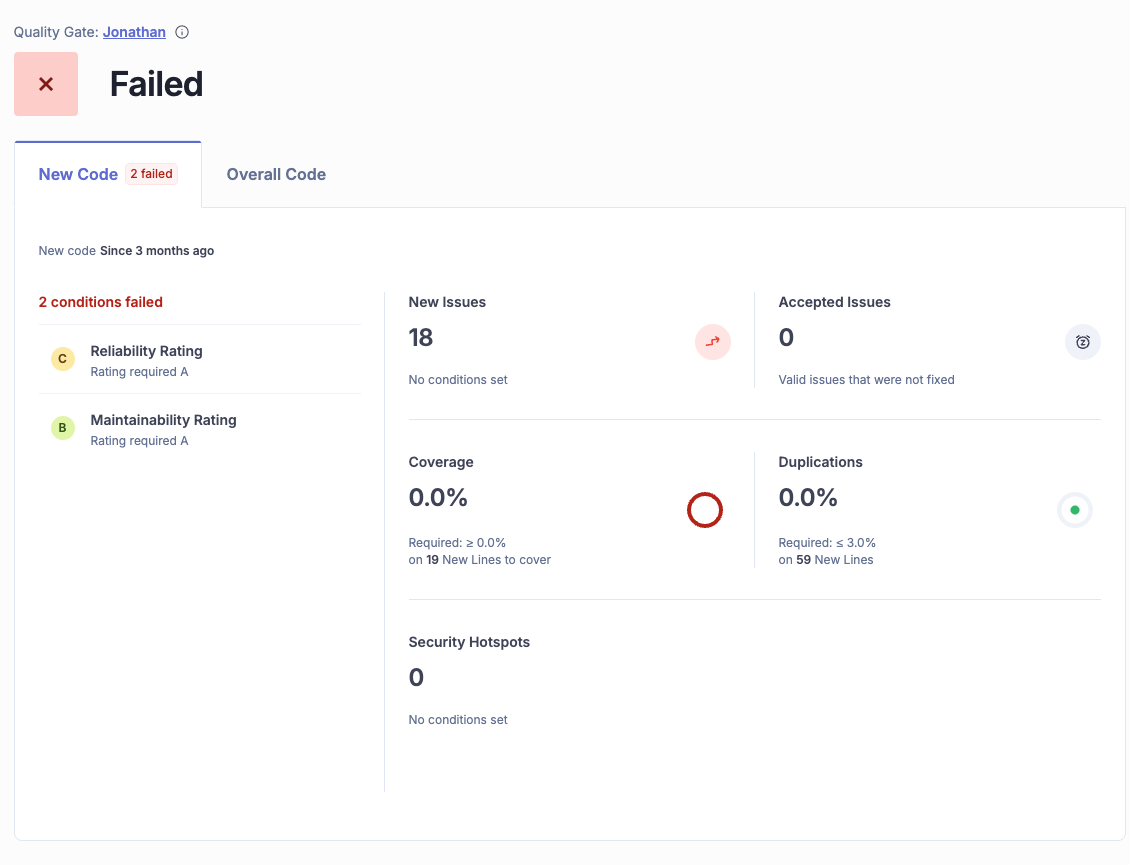
To understand if the application is improving over time, use the SonarQube dashboard.
- New code tab: This is your daily focus. It shows the health of code changed in the current period. Keeping this green ensures you are not introducing new debt.
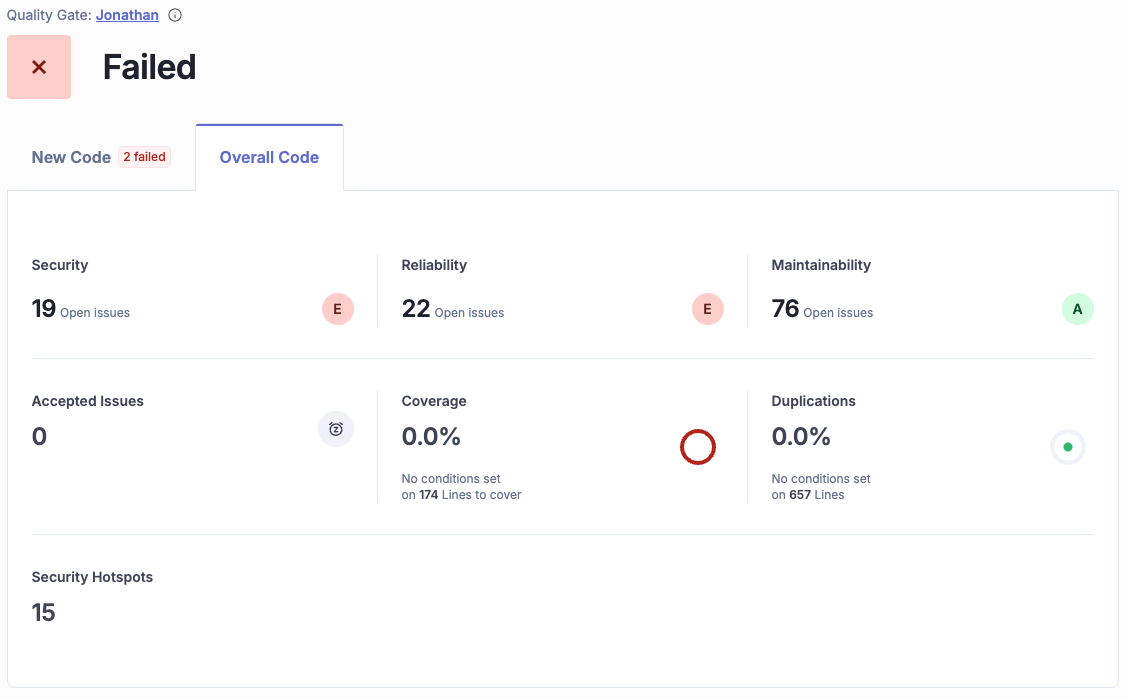
- Overall code tab: This provides a view of the entire project history. This debt should be addressed gradually over time, rather than blocking current development.


Automating analysis with Maven and GitHub Actions
To enforce these checks, analysis should be automated within your CI/CD pipeline.
1. Maven configuration
Add the following properties to your pom.xml to define your project parameters:
<properties>

  <sonar.organization>my-company-org</sonar.organization>

  <sonar.host.url>https://sonarcloud.io</sonar.host.url>

  <sonar.projectKey>my-company_my-java-app</sonar.projectKey>

</properties>
Now, you can run the analysis manually from your terminal (great for debugging):
# You need your SONAR_TOKEN (generate it in My Account -> Security)

mvn verify sonar:sonar -Dsonar.token=your_generated_token_here
2. GitHub Actions pipeline
Configure a workflow (e.g., .github/workflows/build.yml) to build and analyze your code on every push. Ensure you have added your SONAR_TOKEN to your repository secrets.
name: Build and Analyze
on:
push:
branches:
- main
pull_request:
types: [opened, synchronize, reopened]
jobs:
build:
runs-on: ubuntu-latest
steps:
- uses: actions/checkout@v3
with:
fetch-depth: 0 # Important for accurate analysis
- name: Set up JDK 17
uses: actions/setup-java@v3
with:
java-version: 17
distribution: 'temurin'
cache: 'maven'
- name: Build and Analyze
env:
GITHUB_TOKEN: ${{ secrets.GITHUB_TOKEN }}
SONAR_TOKEN: ${{ secrets.SONAR_TOKEN }}
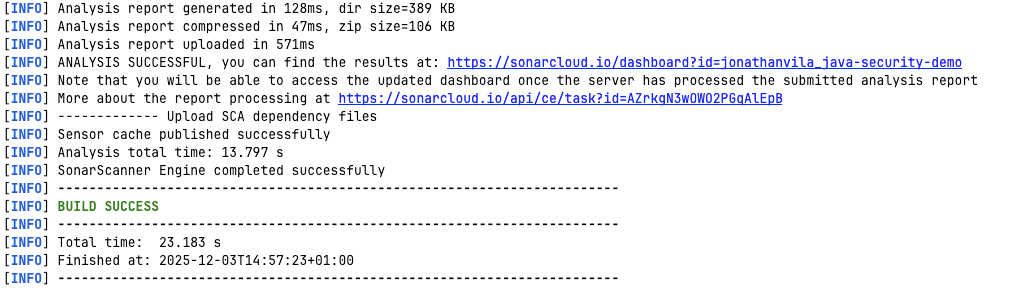
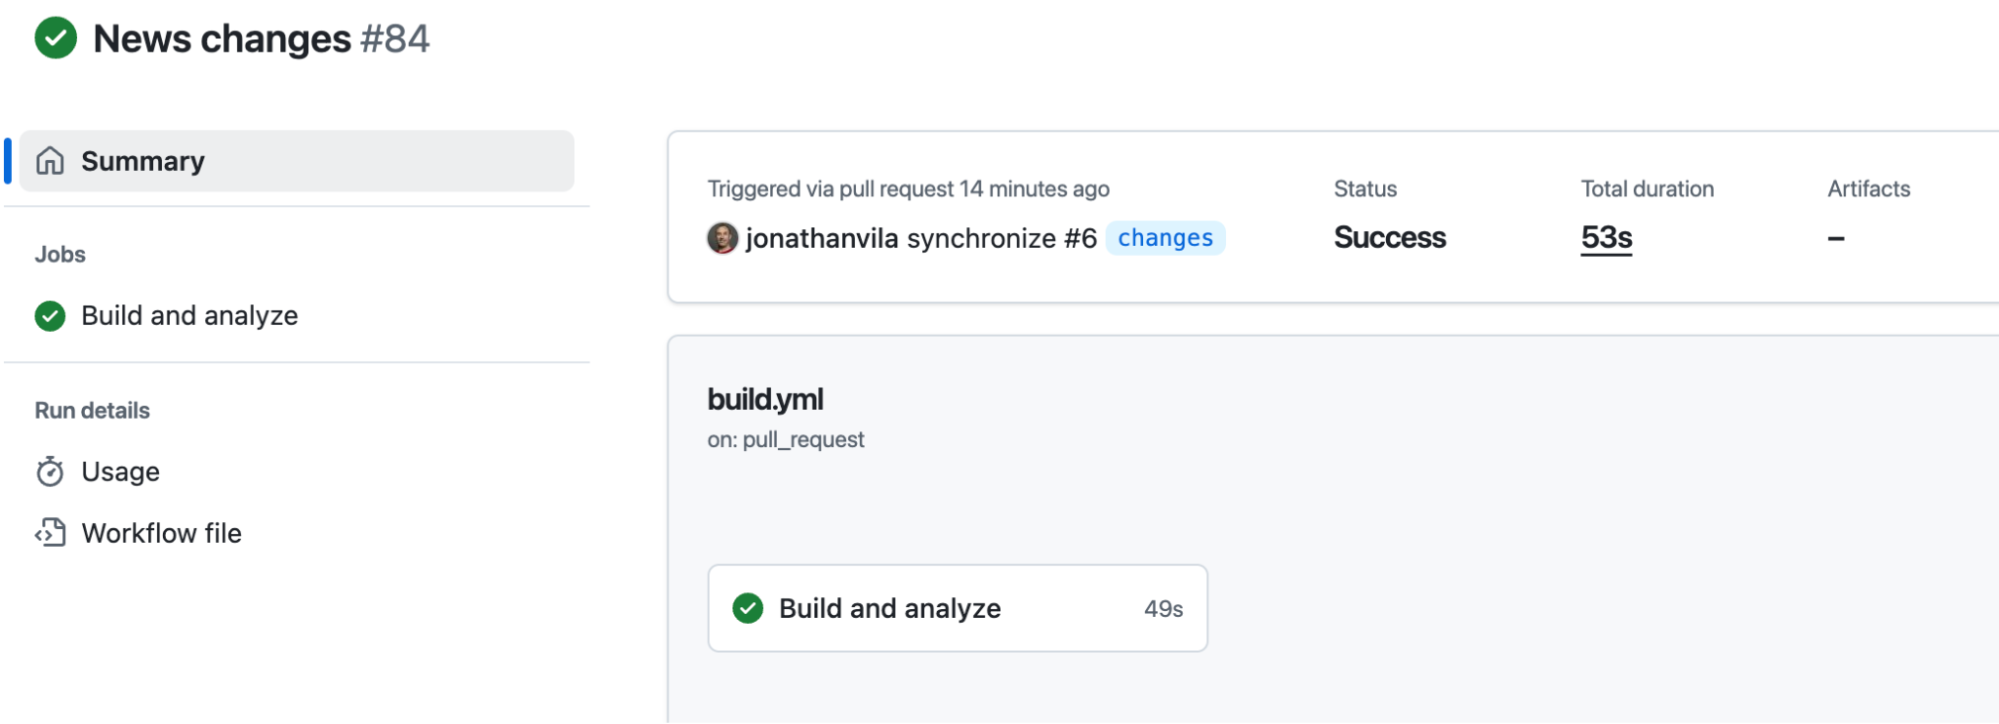
run: mvn -B verify org.sonarsource.scanner.maven:sonar-maven-plugin:sonarBy leveraging the pull_request trigger and the GITHUB_TOKEN, SonarQube Cloud automatically decorates your PRs with analysis results.


Summary
By implementing these steps, you shift from individual code checking to a unified team standard:
- Connected Mode ensures your IDE rules match server rules.
- Taint analysis catches complex security vulnerabilities.
- Quality gates focused on new code allow you to improve quality without stalling on legacy debt.
- CI/CD automation provides immediate feedback directly in your pull requests.
In the next part of this series, we will discuss securing your software supply chain using SonarQube Advanced Security and SBOMs.