
Author: Killian Carlsen-Phelan
TL;DR overview
- Connecting Zed's Agent Panel to SonarQube Cloud brings Sonar Context Augmentation and SonarQube Agentic Analysis into the IDE's AI agent through a single project-scoped configuration.
- The Guide phase pulls project-specific coding guidelines, code navigation, and architecture context into the agent before it generates code, so edits respect existing standards.
- The Verify phase runs Sonar's advanced code analysis on the agent's changes and surfaces bugs, vulnerabilities, and code smells with rule-level reasoning.
- An agent directive drives when each phase fires, while the SonarQube MCP server brokers the connection between Zed and SonarQube Cloud.
Overview
This blueprint configures Zed's Agent Panel against SonarQube Cloud so the agent calls get_guidelines automatically before code edits and run_advanced_code_analysis on demand after, all from a single project-scoped .zed/settings.json. The setup uses the SonarQube MCP server running in Docker, with the cag,projects,analysis,rules toolset combination that exposes both Sonar Context Augmentation (the Guide phase) and SonarQube Agentic Analysis (the Verify phase) in one config.
The demo uses a fresh clone of Microsoft/gctoolkit, a multi-module Java project for parsing GC logs, connected to a SonarQube Cloud project where both features are enabled. Any analyzed Java project will work the same way; gctoolkit is convenient because it has predictable architecture surface and a well-covered Java rule profile.
Architecture
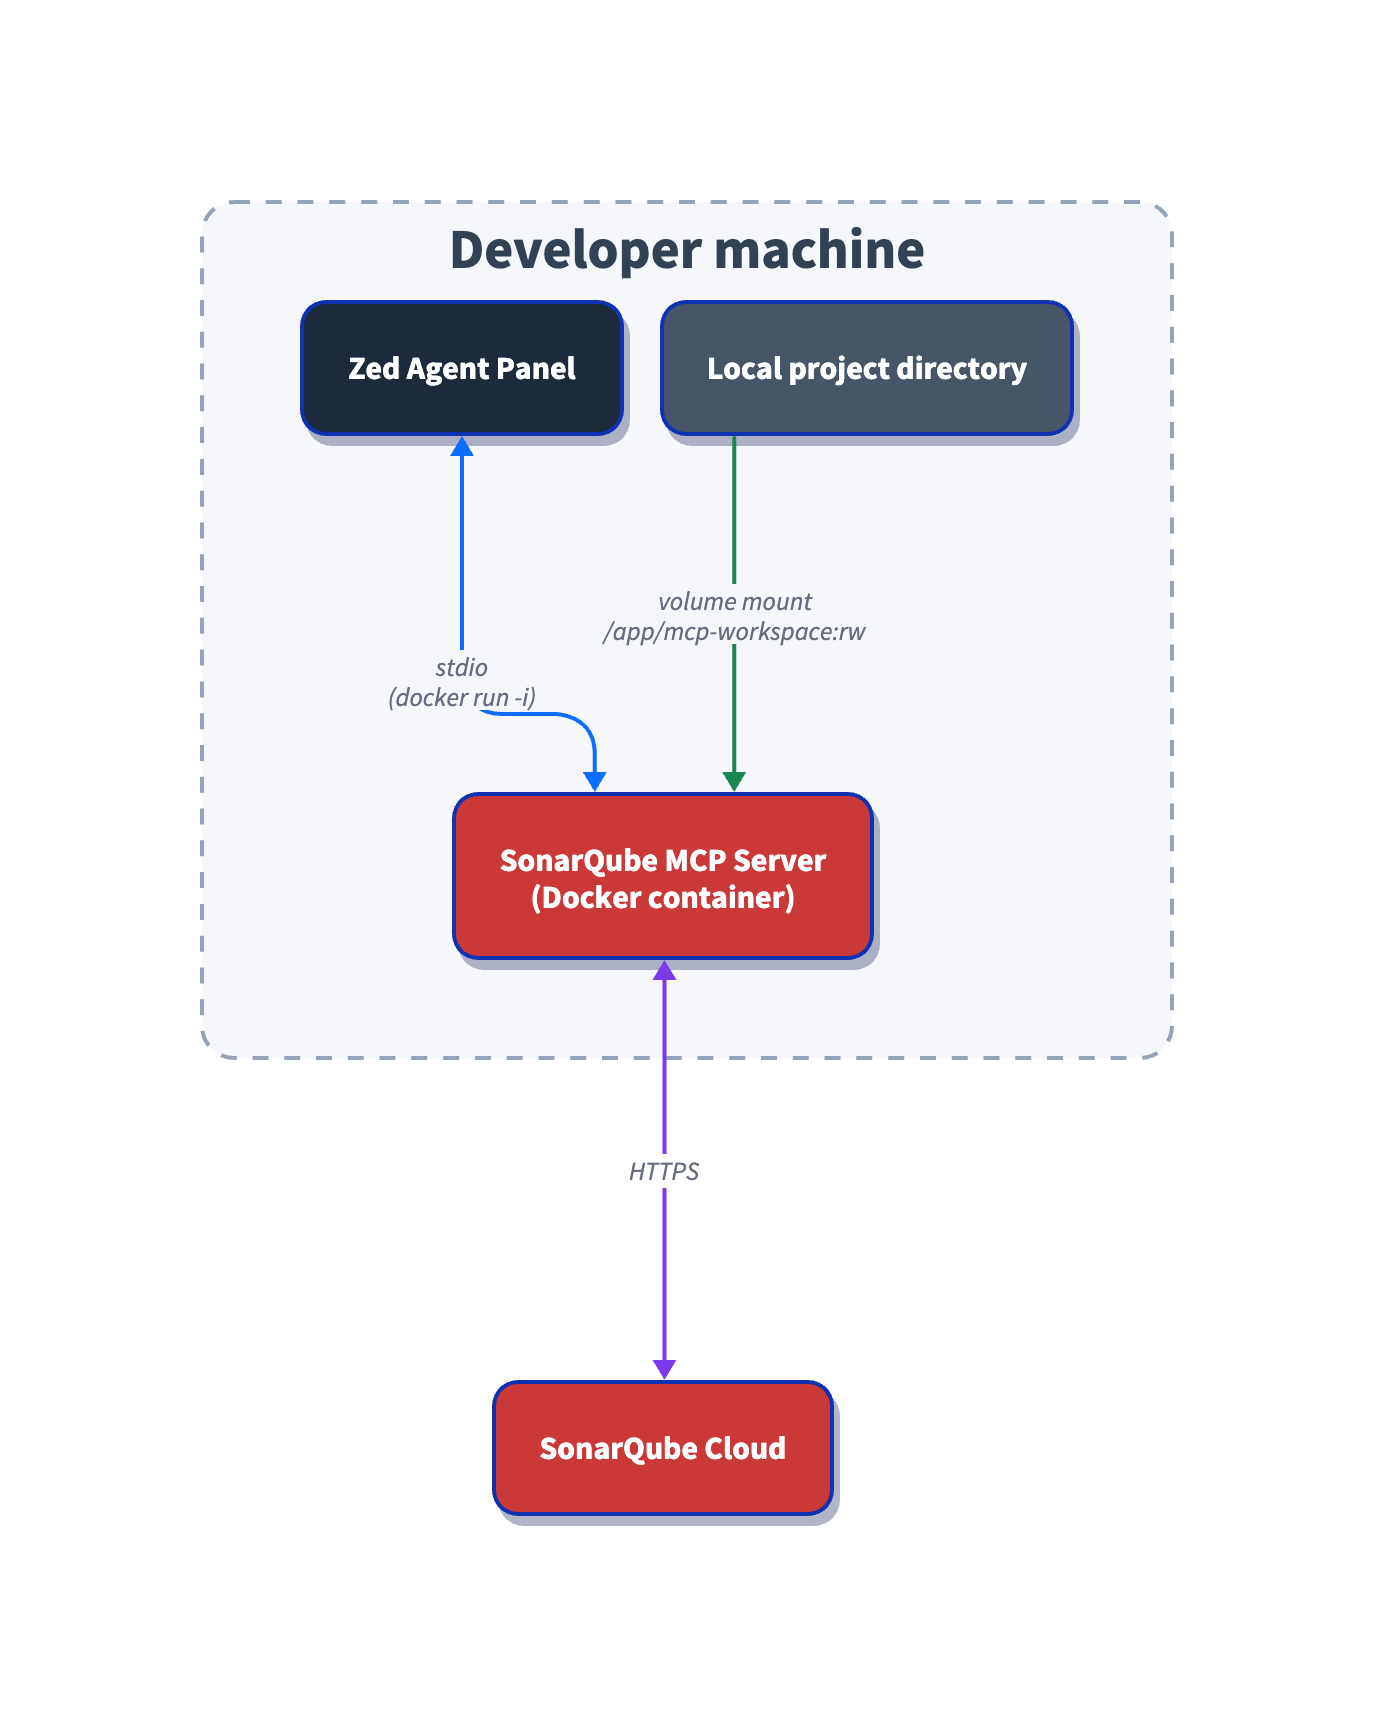
The MCP server runs locally in Docker, talks to Zed over stdio, and proxies tool calls to the SonarQube Cloud REST API. The volume mount maps your project directory into the container so the architecture tools can read your codebase structure without uploading source code.
Why not the official Zed extension
The SonarSource/sonarqube-mcp-server-zed extension installs from the Zed extension registry and works for default-toolset workflows, but it doesn't cover Context Augmentation or Agentic Analysis. The extension forwards only SONARQUBE_TOKEN, SONARQUBE_URL, and SONARQUBE_ORG to the underlying server. Without SONARQUBE_TOOLSETS, get_guidelines and the architecture and analysis tools never appear in the Agent Panel. Without SONARQUBE_PROJECT_KEY and a volume mount, run_advanced_code_analysis and the architecture tools can't run either.
Until those env vars get passthrough support upstream, the manual .zed/settings.json route below is the supported path for Guide and Verify in Zed.
Prerequisites
- SonarQube Cloud Team or Enterprise plan with both Sonar Context Augmentation and SonarQube Agentic Analysis enabled at the organization level. Check plans and pricing if you're not sure which plan you're on.
- A SonarQube Cloud project connected to your repository and analyzed on a long-lived branch via your CI pipeline. For Agentic Analysis specifically, the project must be analyzed at least once after Agentic Analysis is enabled for the organization, so the service collects context. If you enable Agentic Analysis on an existing project, trigger a fresh CI scan before running this blueprint.
- Zed 1.0+. Verify with
zed --version. Install viabrew install --cask zedon macOS or zed.dev/docs/getting-started. - Docker Desktop, running.
docker infoshould succeed. - A SonarQube Cloud Personal Access Token (PAT). Generate one under My Account > Security > Generate Token. The MCP server requires a PAT (a SonarQube Cloud user token); other token types are not supported for the Agentic Workflow.
Step 1: Project-scoped Zed MCP config
In the root of your project clone, create .zed/settings.json:
{
  "context_servers": {
    "sonarqube": {
      "command": "<ABSOLUTE_PATH_TO_DOCKER>",
      "args": [
        "run", "--init", "-i", "--rm", "--pull=always",
        "-e", "SONARQUBE_URL",
        "-e", "SONARQUBE_TOKEN",
        "-e", "SONARQUBE_ORG",
        "-e", "SONARQUBE_PROJECT_KEY",
        "-e", "SONARQUBE_TOOLSETS",
        "-v", "<ABSOLUTE_PATH_TO_PROJECT>:/app/mcp-workspace:rw",
        "mcp/sonarqube"
      ],
      "env": {
        "SONARQUBE_URL": "https://sonarcloud.io",
        "SONARQUBE_ORG": "<YourOrganizationKey>",
        "SONARQUBE_PROJECT_KEY": "<YourProjectKey>",
        "SONARQUBE_TOOLSETS": "cag,projects,analysis,rules"
      }
    }
  }
}
Replace each placeholder:
<ABSOLUTE_PATH_TO_DOCKER>is the output ofwhich docker. Common values are/usr/local/bin/docker,/opt/homebrew/bin/docker, or a path inside Docker Desktop's bundle. Zed launched from the Dock or Finder doesn't inherit your shellPATH, so a bare"docker"will fail. The official Zed extension exposes adocker_pathfield for the same reason.<ABSOLUTE_PATH_TO_PROJECT>is the absolute path to your project clone (the output ofpwdfrom inside it). Relative paths cause silent failures in the architecture tools.<YourOrganizationKey>and<YourProjectKey>are your SonarQube Cloud organization and project keys.
SONARQUBE_TOKEN is deliberately absent from the env block. You'll export it as a shell environment variable in Step 4, and Docker forwards it into the container via the -e SONARQUBE_TOKEN flag in args. The token never lands in .zed/settings.json, which matters if the file gets committed
The toolset value cag,projects,analysis,rules is what makes this a single-config Guide + Verify setup. cag enables get_guidelines and the architecture and navigation tools. analysis enables run_advanced_code_analysis. rules enables show_rule, which the directive in Step 3 calls for every Verify finding. projects is auto-enabled by the server but listed here for clarity.
Step 2: Worktree trusted
Zed worktrees start in Restricted Mode, which blocks MCP servers configured under .zed/settings.json from launching. Open the project (zed . from the project root, or File > Open), wait for the Restricted Mode banner, and click Trust this worktree.
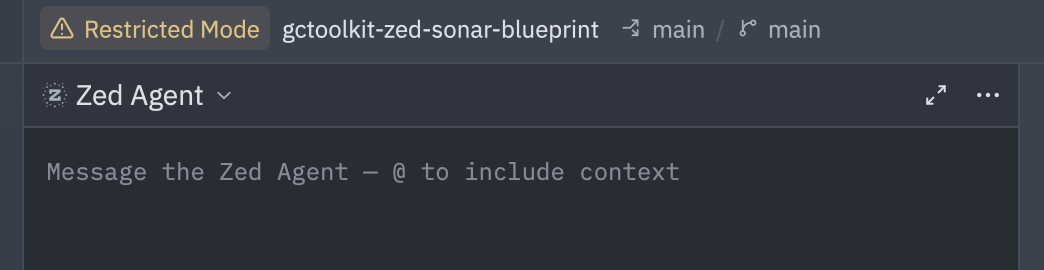
Trust is the most common silent failure for Zed MCP setups, because without it Zed never spawns the Docker container declared in your settings file. The Agent Panel reflects that as an empty Context Servers list with no error message, which is easy to misread as "the server crashed" when it never started. Reference: zed.dev/docs/worktree-trust.
If you have "session": { "trust_all_worktrees": true } set in your user-global ~/.config/zed/settings.json, the banner won't appear because the worktree is auto-trusted. That's fine for the setup itself, but if you ever need to confirm the trust prompt is working (or capture the banner for your own docs), flip the setting to false temporarily and reopen the project.
Step 3: Operational directive in place
Create AGENTS.md in the project root (not inside .zed/):
# SonarQube Agentic Workflow - Usage Directive (MUST FOLLOW)

## GUIDE Phase - Before Generating Code
1. Call `get_guidelines` for project context and coding standards
2. Locate existing code with `search_by_signature_patterns` or `search_by_body_patterns`. Do this before you explore the files directly — they will speed up the process.
3. Read implementation with `get_source_code`

When changing architecture or dependencies:
- Check `get_current_architecture` and `get_intended_architecture`
- Analyze impact using:
  - `get_upstream_call_flow` / `get_downstream_call_flow` - trace method calls
  - `get_references` - find all usages
  - `get_type_hierarchy` - check inheritance

## VERIFY Phase - After Generating Code
1. Read Phase: Load current state of relevant source files
2. Analysis Phase: Call `run_advanced_code_analysis` with:
   - filePath: Project-relative path
   - branchName: Active development branch
   - fileScope: ["MAIN"] or ["TEST"]
3. Evaluation & Remediation:
   - Call `show_rule` for every issue
   - Mandatory fix any issue with `impacts[].severity` of HIGH or BLOCKER, or any issue with `impacts[].softwareQuality` of SECURITY
4. Verification: Re-run analysis after fixes
Zed's rules priority order reads AGENTS.md automatically when no higher-priority file (.rules, .cursorrules, .windsurfrules, .clinerules, .github/copilot-instructions.md, AGENT.md) is present. If your project already has one of those, either remove it or move the directive content into it. The same AGENTS.md is read by other tools that follow the convention, including OpenAI's Codex CLI, so the directive ports cleanly between agents on the same repo.
Step 4: Token exported, Zed launched, MCP shows green
Export the token in your shell, then launch Zed from that same terminal:
export SONARQUBE_TOKEN="<your-personal-access-token>"
cd /path/to/your/project
zed .
Zed launched from the Dock or Finder doesn't inherit your shell environment, so a SONARQUBE_TOKEN exported in a terminal session doesn't reach a Dock-launched Zed session. If you prefer a Dock workflow, use a launcher like direnv or a shell wrapper to inject the env into Zed's process. Without that injection the MCP server starts fine, but SonarQube calls fail authentication silently.
Open the Agent Panel, then open the panel's Settings view (in the panel toolbar) and find sonarqube under Context Servers. You're looking for a green indicator dot to let you know the server is active.
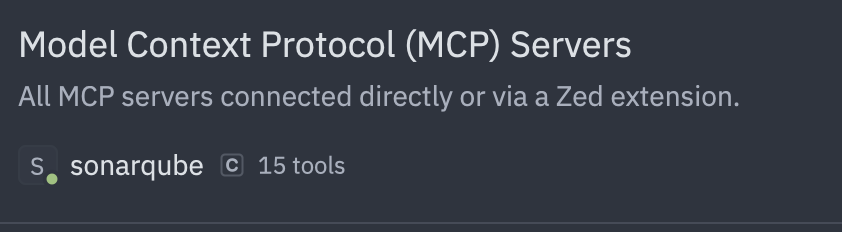
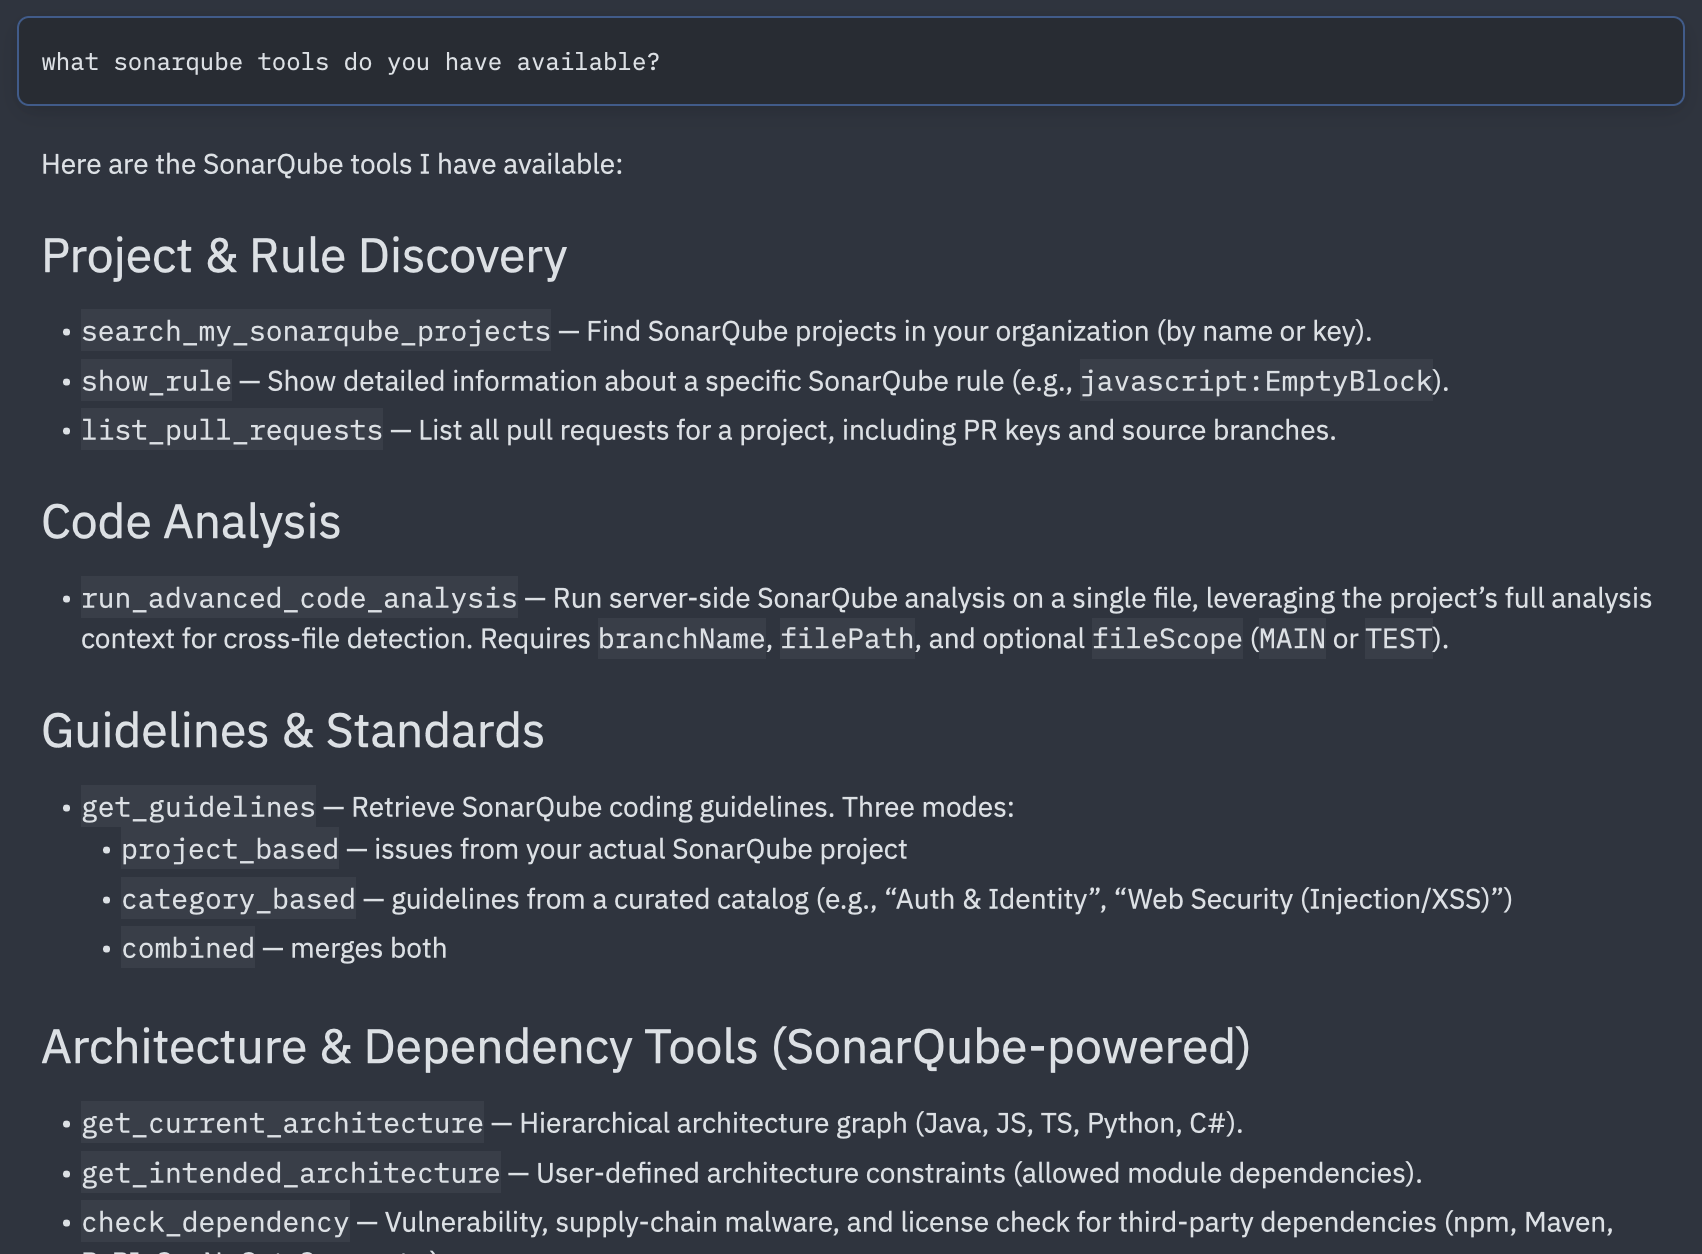
Ask the agent in a new thread to list the SonarQube tools it has available. With SONARQUBE_TOOLSETS=cag,projects,analysis,rules you should see ~15 tools, with the exact count drifting as the mcp/sonarqube image version updates. Representative names include:
get_guidelinessearch_by_signature_patterns,search_by_body_patternsget_source_code,get_references,get_type_hierarchyget_upstream_call_flow,get_downstream_call_flowget_current_architecture,get_intended_architecturerun_advanced_code_analysisshow_rulesearch_my_sonarqube_projects
If the tool list looks wrong, work backwards from the symptom:
- No
sonarqubeserver in the Settings view. Worktree probably isn't trusted (Step 2), or.zed/settings.jsonhas a JSON syntax error. - Server listed but indicator is red. Docker isn't running, or the
commandpath isn't absolute. - Server is green but tool calls return 401 or "name does not resolve".
SONARQUBE_TOKENisn't visible to Zed (Dock-launch passthrough), orSONARQUBE_URLis wrong (https://sonarcloud.iofor the EU instance,https://sonarqube.usfor US). - Only
search_my_sonarqube_projectsvisible, no Context Augmentation or Agentic Analysis tools. Context Augmentation/Agentic Analysis isn't enabled at the organization level.
Step 5: Guide phase fires automatically
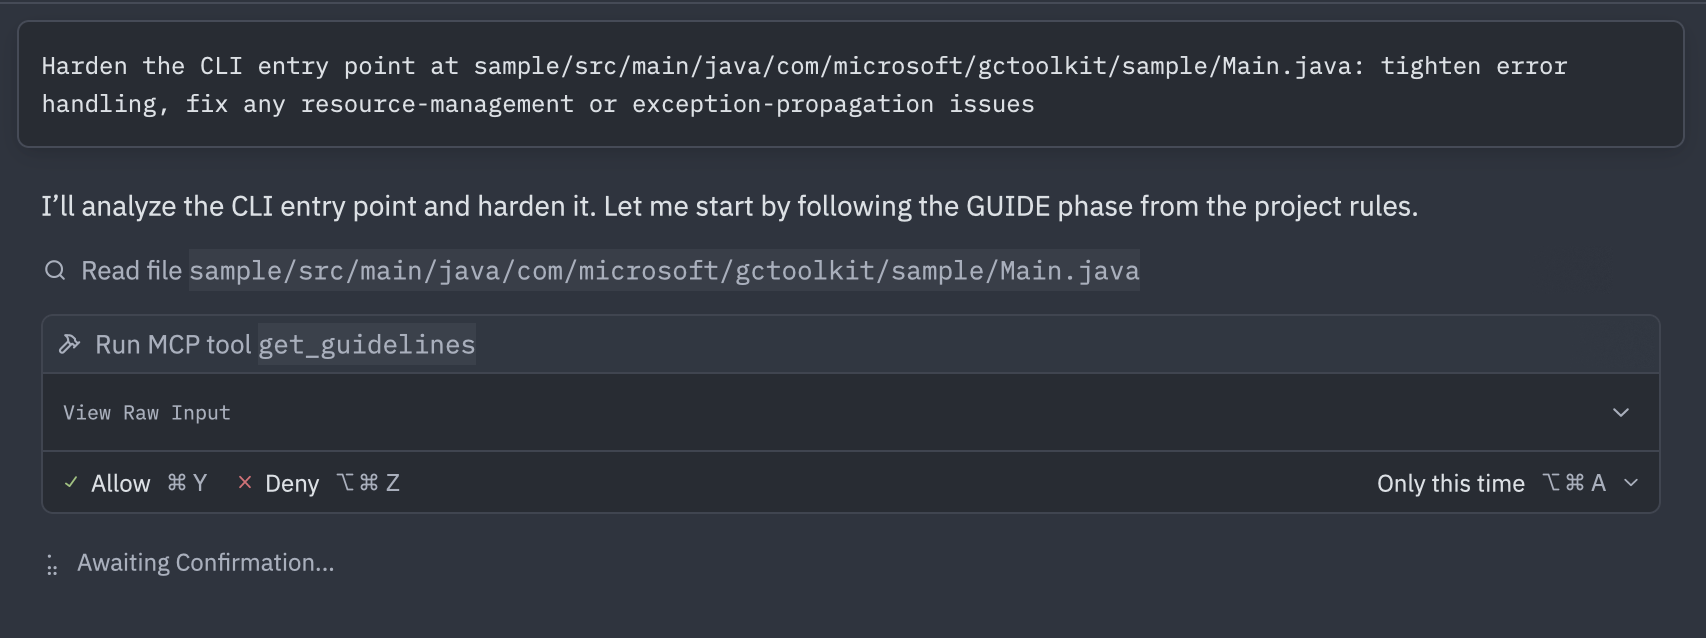
Open a new thread and prompt the agent with a real coding task against a file in your project. The exact prompt is flexible, so long as it's a code-edit task on a real source file, since that's what makes the AGENTS.md directive trigger the Guide-phase tools before any edit lands. In the demo run, the prompt was a hardening request against sample/src/main/java/com/microsoft/gctoolkit/sample/Main.java.
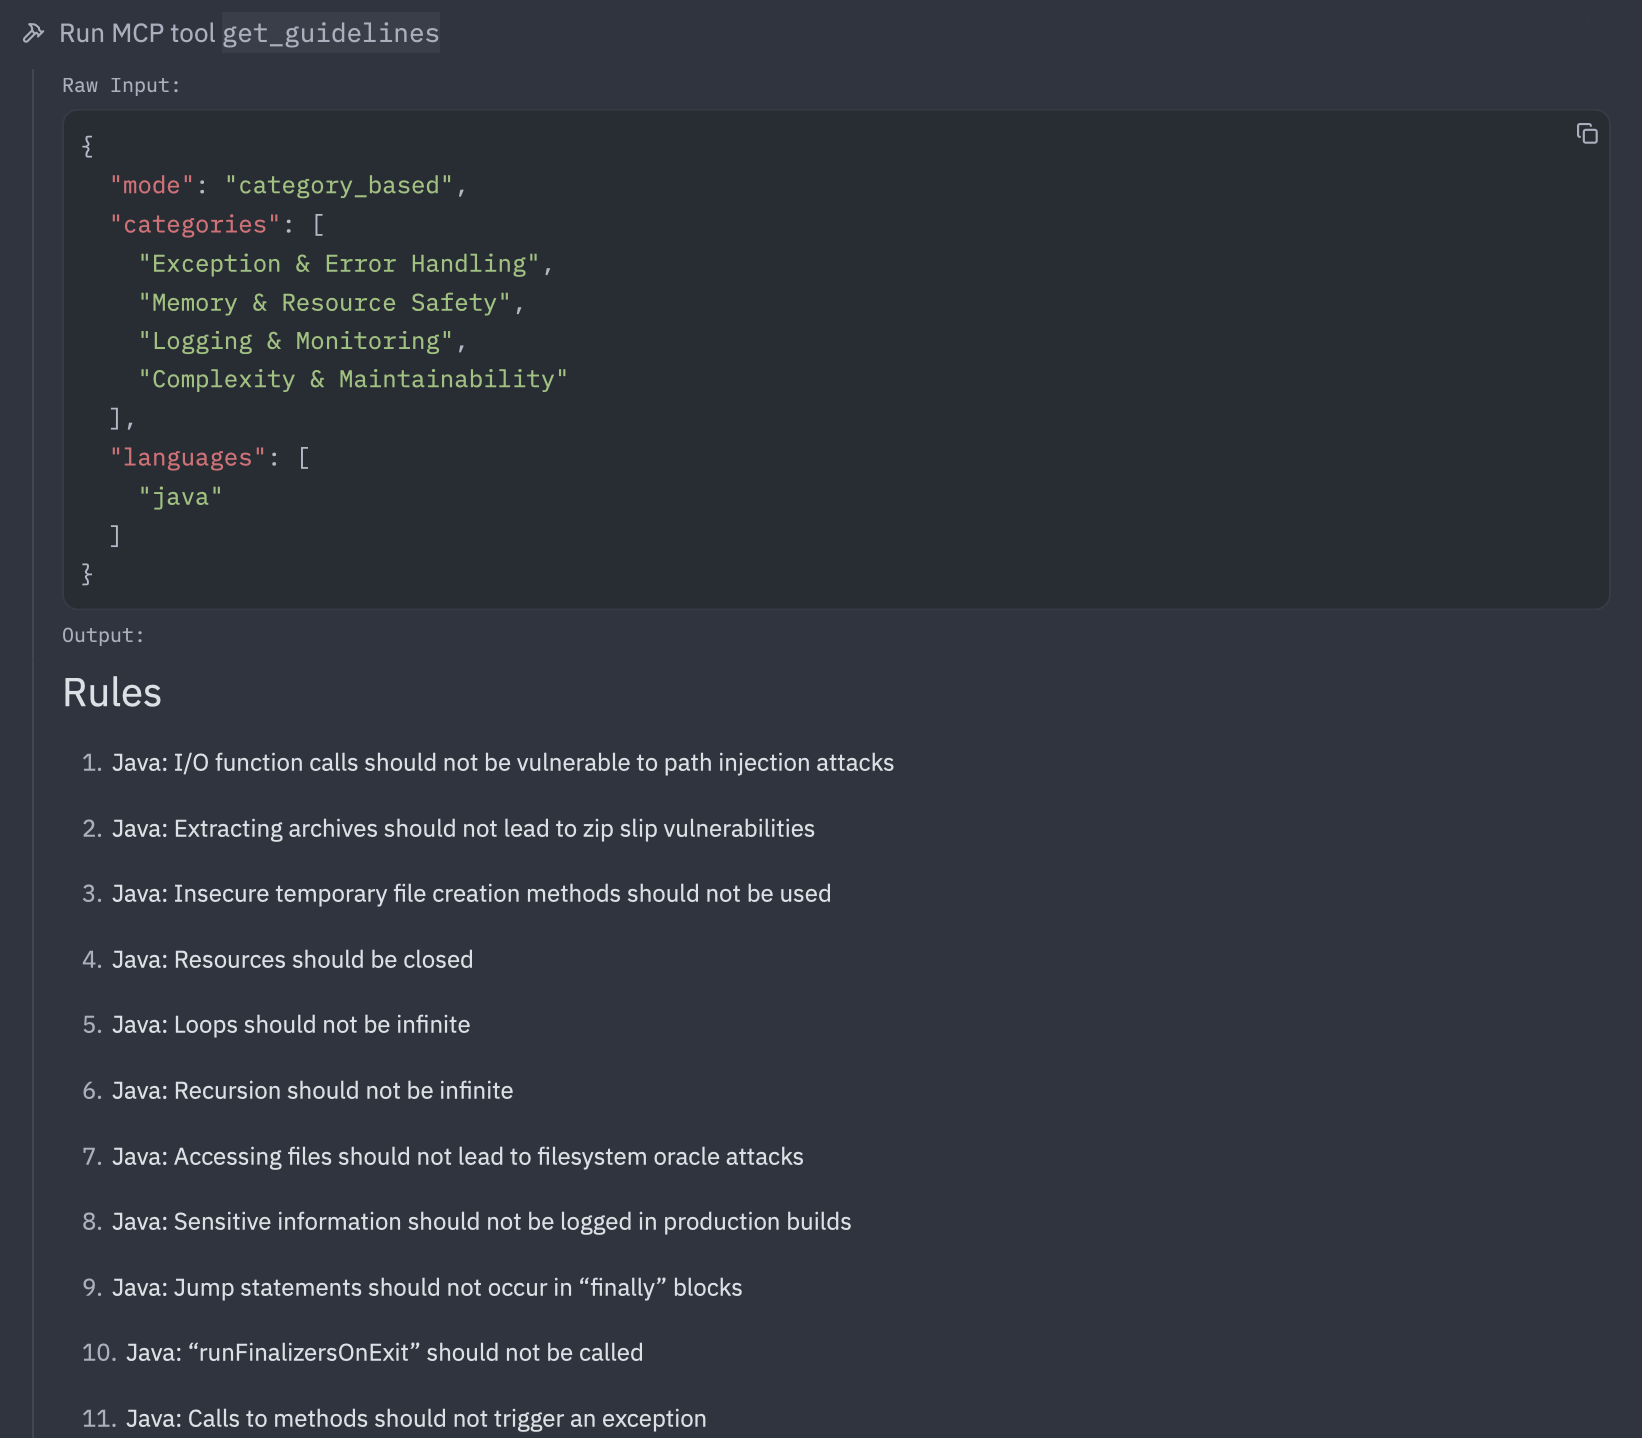
get_guidelines fires because of the directive, not because the agent inherently knows about SonarQube. In the demo run the agent inferred four categories from the hardening framing: Exception & Error Handling, Memory & Resource Safety, Logging & Monitoring, and Complexity & Maintainability. The call returned 20 rules across those categories, spanning security, reliability, and code-smell territory.
In the demo the agent opened Main.java via Zed's native file-read tool first, then queued get_guidelines, then followed with search_by_signature_patterns and search_by_body_patterns to locate related code.
Zed's native agent tools (file read, regex search, diagnostics) will interleave with the MCP tool calls throughout. That's expected, since native tools handle file I/O and project diagnostics while MCP tools handle SonarQube intelligence.
Step 6: Architecture probe on demand
The architecture tools fire conditionally per the directive, which scopes them to "when changing architecture or dependencies." A single-file edit doesn't trigger them. To exercise the architecture surface, prompt explicitly in the same thread or a fresh one:
What is the current architecture of this project?
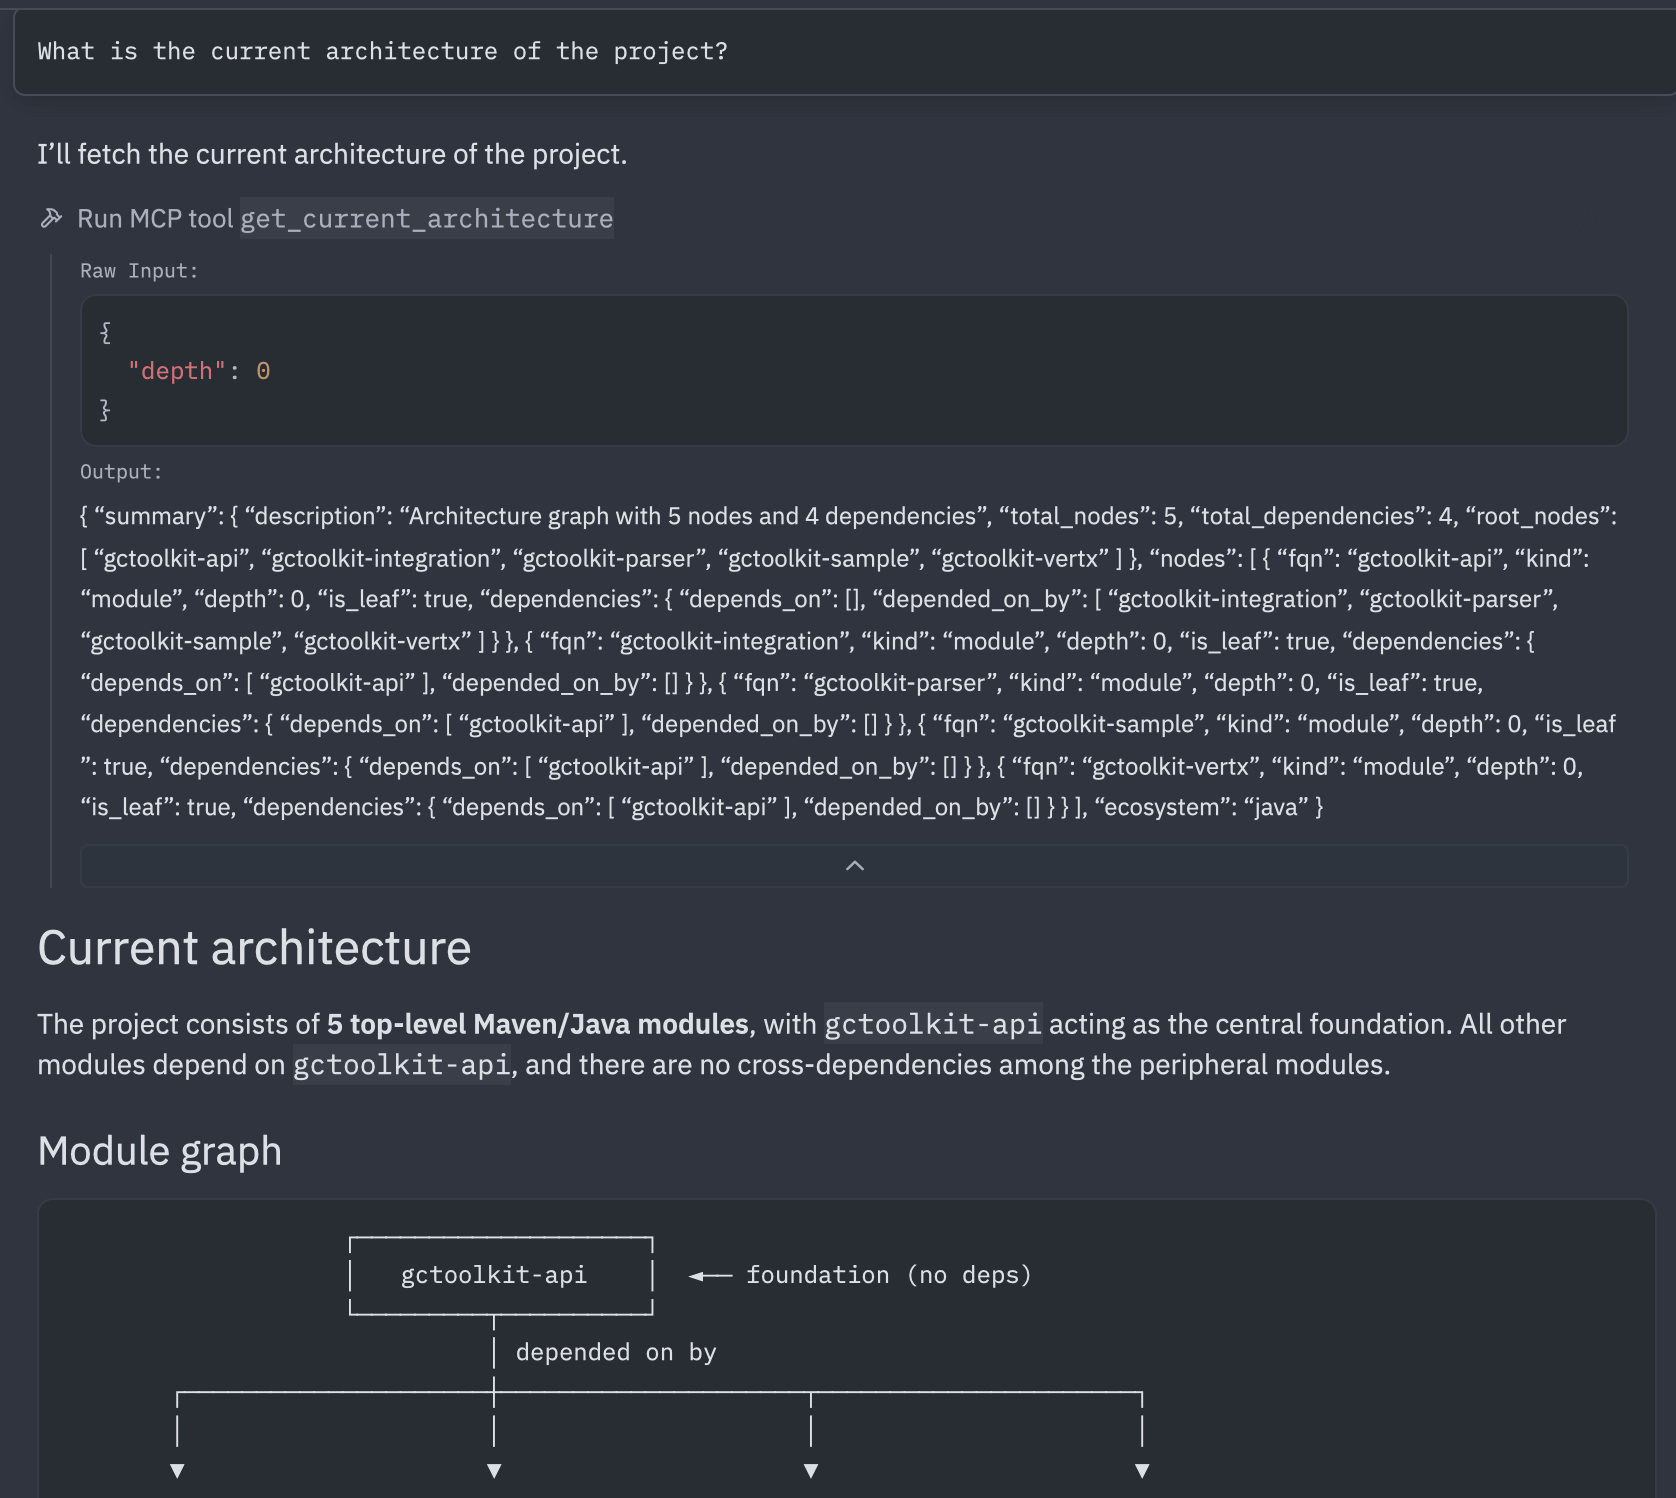
The agent calls get_current_architecture, typically probing multiple ecosystems (java, js, ts, py, cs), and only uses the ones that have data returned from the project's CI scan. For gctoolkit the demo returned five Java modules in a hub-and-spoke topology around gctoolkit-api, with parser, vertx, sample, and integration as leaves and gctoolkit-api as the only inbound-edge module. The agent rendered an ASCII module graph and a per-module summary table from the raw JSON response.
This step exists mainly to confirm the architecture toolset is wired up. The same tools support a full navigation flow when you need it, including call-flow tracing with get_upstream_call_flow and get_downstream_call_flow, type hierarchy lookups with get_type_hierarchy, and intended-versus-current architecture comparisons with get_intended_architecture.
Step 7: Verify phase with directive-driven triage (Agentic Analysis)
Continue from Step 5's thread or start a new one, then prompt the agent to run analysis on a file you've changed. This screenshot shows the automatic behavior that continued from step 5, without needing to re-prompt the agent.
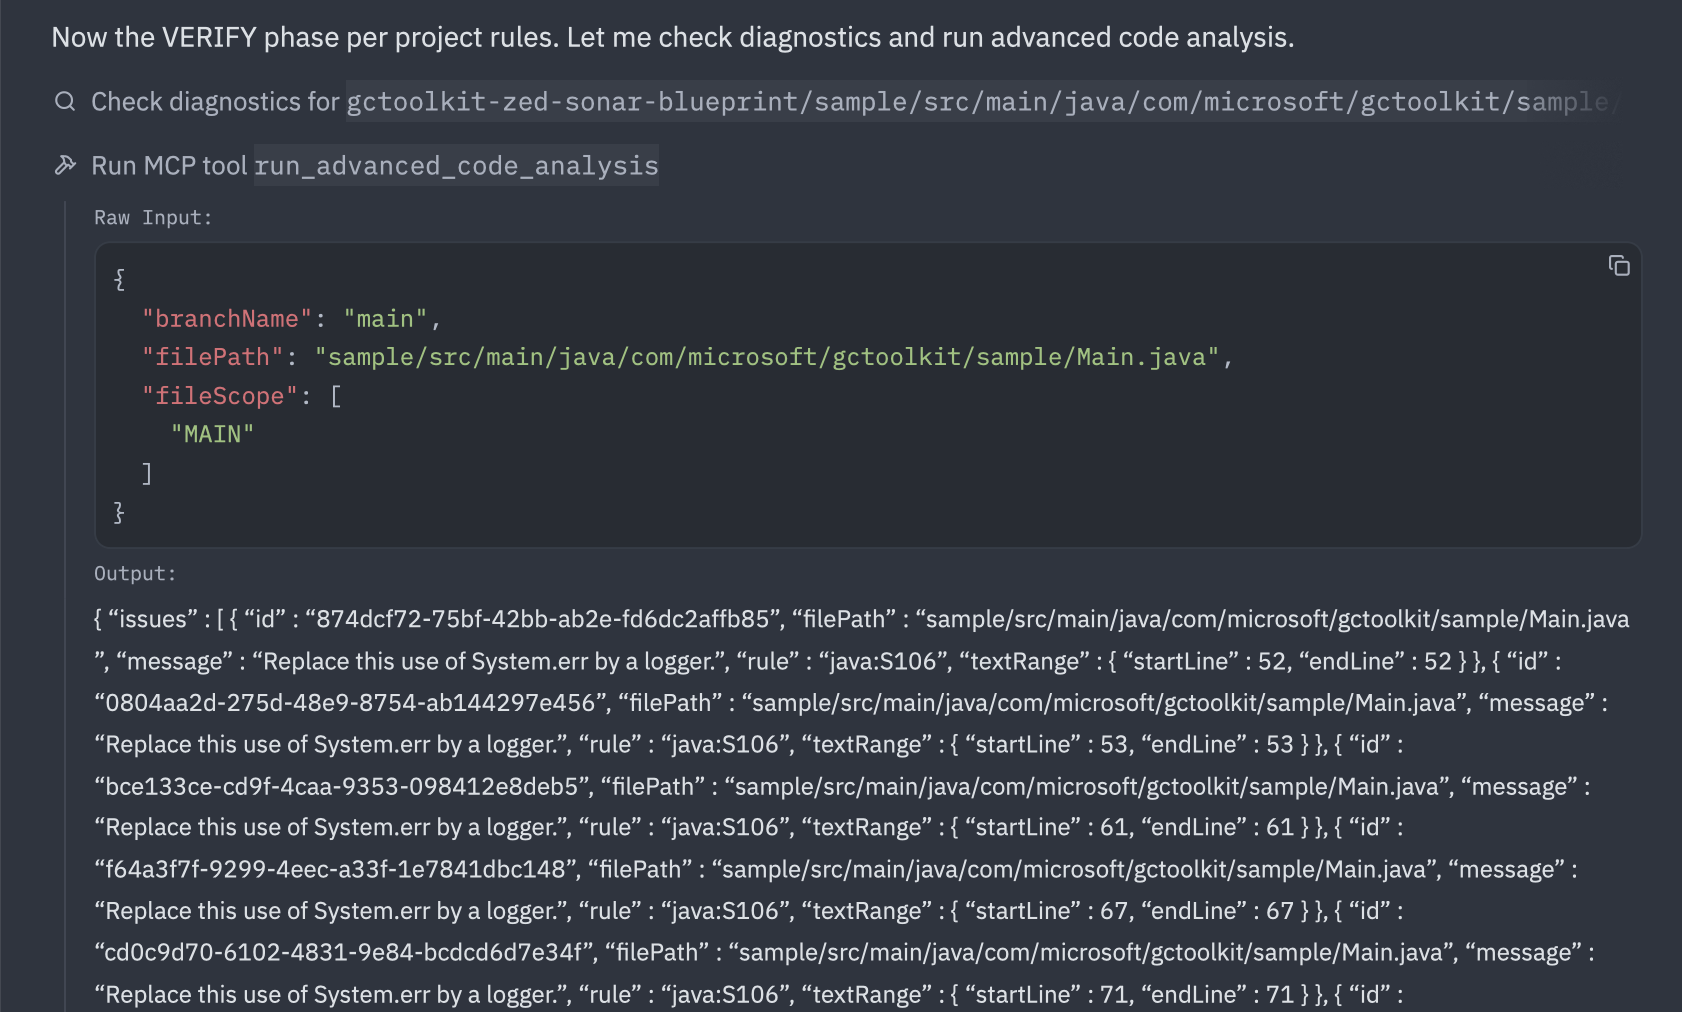
Findings depend on the file you chose, the agent's edits, and your project's quality profile, so they aren't predictable in advance. In the demo run, the call returned 14 java:S106 findings ("Standard outputs should not be used directly to log anything"). The agent then called show_rule to read the full rule definition before declining to fix any of them, because the directive's mandatory-fix threshold is HIGH or BLOCKER and java:S106 sits below that. The agent's own reasoning, paraphrased: for a command-line tool, System.out for results and System.err for diagnostics are appropriate, and switching to a logger without project-level logging configuration would degrade UX.
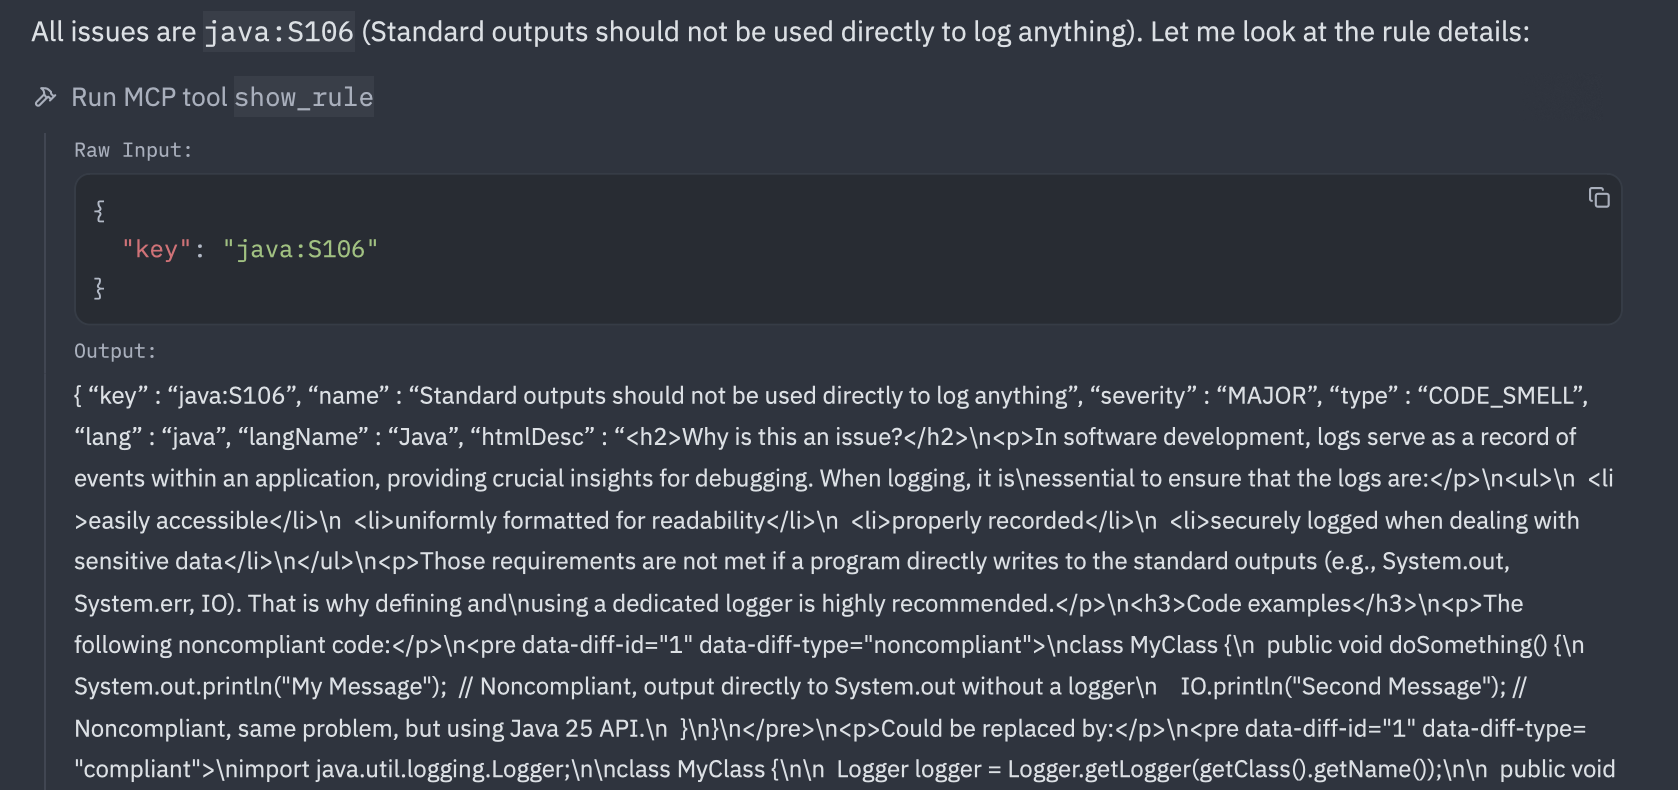
The directive drives both the fixes and the principled non-fixes, and the agent's surfaced reasoning is what makes each decision auditable. If your run surfaces a HIGH or BLOCKER finding, or anything tagged with the SECURITY software quality, the directive instructs the agent to fix the issue and re-run analysis until the file comes back clean.
What to know
- The agent may pick the
get_guidelinesmode (project_based,category_based, orcombined) based on how you phrase the prompt. Thecombinedmode merges catalog rules with real findings from your project's analysis history and may give richer results. run_advanced_code_analysisreturns every finding on the file, not just new ones introduced by the agent. When the response is long, triage new versus pre-existing before reacting, because the noise often predates anything the agent touched.- Both Context Augmentation and Agentic Analysis are currently in Beta
Next steps
- The SonarQube MCP server repository holds the full toolset matrix and environment variable reference, which is useful when you want to expand beyond the four toolsets used here.
- The Zed AI/MCP docs and the worktree-trust docs cover Zed's MCP integration and the trust model that gates it. Keep both handy if you hit anything Zed-side that this blueprint doesn't address.Organizations can ensure system stability by tracking change failure rates and using deterministic verification platforms to validate AI-generated output at scale.