
Start your free trial
Verify all code. Find and fix issues faster with SonarQube.
LoslegenTL;DR overview
- The SonarQube for IDE Visual Studio extension gives .NET developers real-time code quality and security feedback directly inside their IDE.
- The guide explains the three Sonar components - SonarQube Server, SonarQube Cloud, and SonarQube for IDE - and how they work together in a .NET workflow.
- Installation is handled through the Visual Studio Extensions marketplace; issues are surfaced inline as developers write C# and other .NET code.
- Connected Mode links the extension to a central SonarQube instance, synchronizing quality profiles and enabling team-wide consistency.
Introduction: Demystifying the Sonar universe
For many .NET developers, "Code Quality" can feel like a vague corporate term. In practice, it just means code that's reliable, secure, and maintainable—code that isn't a headache to revisit six months from now.
SonarQube has become a standard tool for this. There are several products that work together, and understanding what each piece does is the first step. For a .NET developer, you'll mainly encounter three components:
- SonarQube Server: This is the self-hosted, self-managed server. It's the central hub for all your code analysis. It processes full project scans, stores historical data, tracks metrics, and provides the main web dashboard for managing technical debt. It's your team's single source of truth for code quality.
- SonarQube Cloud: This is the SaaS version of SonarQube, managed by Sonar. It gives you the same functionality but eliminates the overhead of hosting your own server. It integrates natively with cloud-based platforms GitHub, Azure DevOps, BitBucket, and GitLab. If your team is already in the cloud, this is often the fastest way to get started with centralized analysis.
- SonarQube for IDE: This is the free IDE extension for Visual Studio, VS Code, etc., that gives you immediate, real-time feedback as you code. It analyzes files on the fly, highlighting bugs, vulnerabilities, and code smells right in your editor, long before you even commit.
You probably know the IDE extension as SonarLint. The name was recently changed to "SonarQube for IDE" to make its role in the ecosystem clearer. This isn't just a marketing change; it highlights a key concept: while the extension is great on its own, its real power is unlocked in "Connected Mode" with a SonarQube Server or Cloud instance.
This connection syncs the rules and settings from the central server directly to your IDE. The goal is to ensure every developer on the team is following the exact same quality standard.
Here’s a quick comparison:
| Feature | SonarQube for IDE | SonarQube Server | SonarQube Cloud |
| Purpose | Real-time feedback in the IDE | Centralized analysis & historical tracking | Centralized analysis (SaaS) |
| Hosting | Local (IDE Extension) | Self-Hosted (On-premise, Docker, etc.) | Cloud (Managed by Sonar) |
| Scope | Current file / Local changes | Entire project / All branches | Entire project / All branches |
| Use Case | Individual developer writing code | Team collaboration, CI/CD integration, governance | Teams using cloud-based DevOps platforms |
Installation and first impressions in Visual Studio
The fastest way to improve code quality is to get feedback while you're still writing the code. SonarQube for IDE provides this "shift-left" feedback right in your editor. You can get started with local-only analysis in minutes, no server required.
To install the extension in Visual Studio 2022:
- Launch Visual Studio.
- Navigate to the Extensions menu and select Manage Extensions.
- In the search bar, type "SonarQube for IDE".
- Click the Download button.
- Close all instances of Visual Studio. The VSIX installer will run.
- Once the installation is complete, re-launch Visual Studio.

The extension is active immediately. No configuration is needed to get value from its local analysis. It will automatically start inspecting open C# and VB.NET files against a default set of rules.
Real-time feedback in action: Finding your first bug
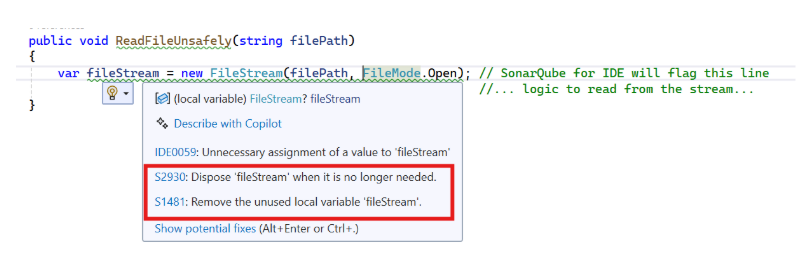
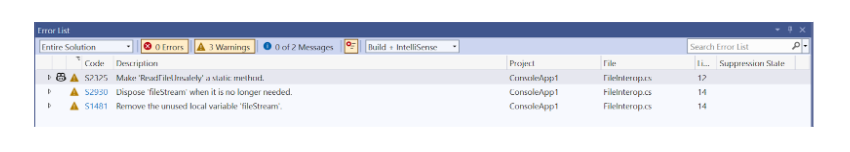
The value of SonarQube for IDE is its immediacy. As soon as you open a C# file, it starts working. Let's use a classic example: an improper IDisposable implementation, which can lead to resource leaks and violates Sonar rule RSPEC-2930.
// Non-compliant code: RSPEC-2930: "IDisposables" should be disposed

public void ReadFileUnsafely(string filePath)

{

    var fileStream = new FileStream(filePath, FileMode.Open); // SonarQube for IDE will flag this line

    //... logic to read from the stream...

}
As soon as you type this, you'll get two visual cues: a green squiggly under the new FileStream(...) expression, and a corresponding warning in the Visual Studio "Error List" panel, complete with the rule ID. This instant feedback loop helps prevent simple mistakes from ever making it to source control.


More than just a linter: understanding and fixing issues
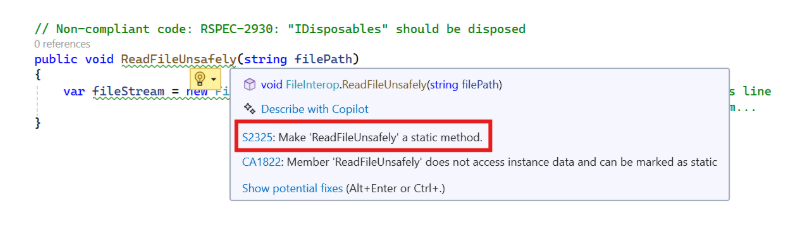
SonarQube for IDE does more than just flag issues. It helps you understand why something is a problem and how to fix it.
You can right-click the issue to get a detailed rule description. This panel explains the impact, shows non-compliant and compliant code examples, and often links to external resources like the relevant OWASP Top 10 or Common Weakness Enumeration (CWE) entries. This feature helps level up your own coding practices over time.

For many issues, you'll also see a "QuickFix" lightbulb. In our FileStream example, it will offer to wrap the object in a 'using' statement. Selecting it automatically refactors the code to the correct, compliant form.
// Compliant code after applying QuickFix

public void ReadFileSafely(string filePath)

{

    using (var fileStream = new FileStream(filePath, FileMode.Open))

    {

        //... logic to read from the stream...

    }

}
For more complex issues, newer versions of the extension, when connected to a paid SonarQube Server or Cloud instance, also offer an AI CodeFix feature.
The power of connection: a glimpse into the full ecosystem
While the standalone mode is valuable, "Connected Mode" is where SonarQube for IDE really shines for a team.
Without it, your IDE is just using a default, built-in set of rules. Using SonarQube also gets you access to a more powerful ruleset, furthering coverage past the IDE. Your teammates might have different versions, and your CI/CD pipeline is likely using a totally custom Quality Profile. This leads to inconsistencies and "it works on my machine" debates about quality.
Connected Mode solves this by syncing your IDE with a project on your SonarQube Server or Cloud. This ensures:
- Consistent Rules: The exact same set of rules (known as a "Quality Profile") is enforced for every developer on the team.
- Shared Settings: Project-specific settings, like issue exclusions, are propagated from the server to the IDE.
- Deeper Analysis: Certain advanced security rules, especially those for taint analysis (tracking insecure user input), are only enabled when connected to a server.
To be honest, configuring Connected Mode can sometimes be tricky, especially in complex environments. However, the value of having a single, unified quality standard for everyone on the team is worth the one-time setup.
To get started with SonarQube for IDE today, follow the link and select your IDE of choice
https://www.sonarsource.com/products/sonarlint/ide-login/
In the next articles, we'll walk through a streamlined process to set up a server and get your IDE connected. This is the bridge from individual code habits to team-wide code quality.