

TL;DR overview
- SonarQube code coverage measures how much of the codebase is exercised by automated tests; it doesn’t itself generate coverage data. It imports reports produced by JaCoCo, coverage.py, Istanbul, or the equivalent tool for your language. The pipeline then runs through four stages, and most failures happen at the handcuffs between them.
- 0% coverage almost always traces to one of seven causes: automatic analysis mode, missing report file, wrong format, wrong scanner property name (deprecated names fail silently), wrong path, scanner running before tests, or file paths inside the report not matching the project layout.
- When numbers don't match between tools, the cause is one of three things: different definitions of "coverable line" (Python
defandimport, JaCoCo closing braces), different file scope (your coverage tool only reports on files tests loaded; SonarQube sees every file), or SonarQube's combined line-plus-branch formula vs. tools that report them separately. - Coverage percentage alone misses tests that exercise code without verifying it. SonarQube rules flag tests with no assertions (
java:S2699), assertions trapped insidepytest.raisesblocks where they never execute (python:S5915), and empty test classes (java:S2187).
Here’s a common developer scenario: every test passes, but SonarQube reports 0.0% code coverage. Or coverage shows up, but the number is 20 points lower than what pytest or JaCoCo reported on the same code, and the scanner logs don't explain why.
The problem is almost never SonarQube itself. Coverage reporting is a four-stage pipeline, and most failures happen at the handoff points between your test framework, your coverage tool, the scanner, and the dashboard. Once you see the pipeline clearly, diagnosing a coverage failure takes minutes.
The coverage pipeline
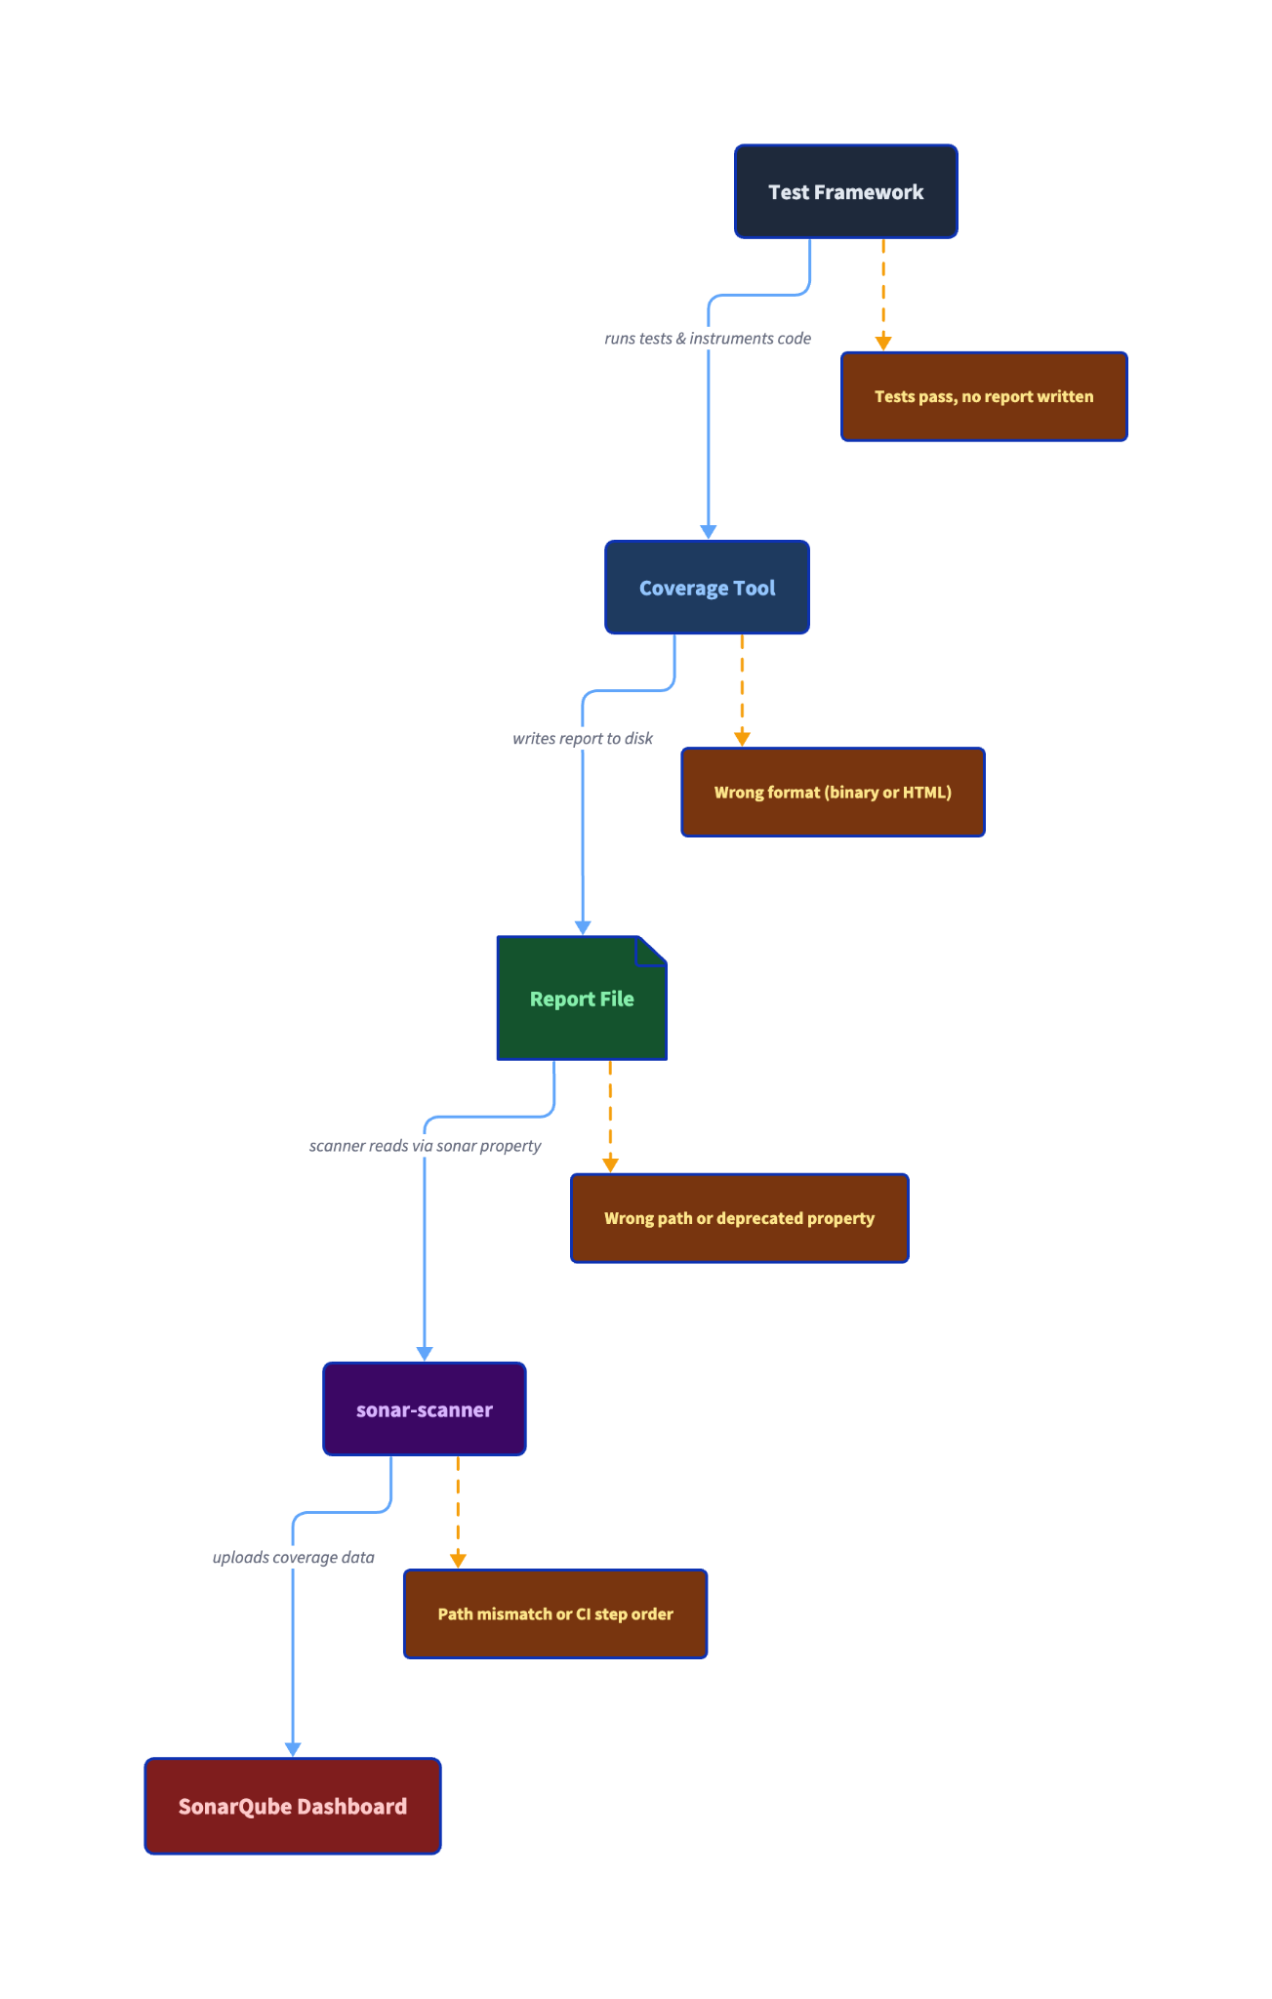
SonarQube does not generate code coverage data. It imports reports produced by third-party tools. The pipeline works like this:
- Your test framework (JUnit, pytest, Jest) runs your tests.
- A coverage tool (JaCoCo, coverage.py, Istanbul/c8) instruments your code and records which lines and branches executed during those tests.
- The coverage tool writes a report file to disk in a specific format (JaCoCo XML, Cobertura XML, LCOV).
- The sonar-scanner reads that report file via a configured analysis property and uploads the data to SonarQube.
The report file is the handoff artifact. It sits between your build tooling and SonarQube's scanner, and it's where most failures happen, such as wrong format, wrong path, or being absent entirely.
In practice, stages 1 and 2 are often a single command. JaCoCo hooks into Maven's test phase. Jest has Istanbul built in. go test -coverprofile combines both. The conceptual separation matters for troubleshooting because the test can pass while the coverage tool fails to produce a report, but you won't need to run two separate commands.
One constraint to know upfront is that coverage requires CI-based analysis, where you run sonar-scanner yourself. SonarQube Cloud's automatic analysis mode doesn't support it.
Each programming language has its own coverage tool, report format, and scanner property:

When coverage shows 0%
The pipeline has four transitions and a failure at any one of them produces the same symptom: 0% coverage on the dashboard. Work through these checks in order as most issues are caught by the first four.
Is coverage supported in your analysis mode?
Automatic analysis doesn't import coverage reports. Check your project's Administration > Analysis Method in SonarQube Cloud. If it says "Automatic," switch to CI-based analysis. No amount of property configuration will fix this.
Does the report file exist?
Before sonar-scanner runs, your build must produce a coverage report. After your test step completes, verify the file is where you expect it:
If the file doesn't exist after your build step, the problem is in your build configuration, not SonarQube.
Is the report in the right format?
Each programming language requires a specific format. Using the wrong one causes the scanner to silently ignore the report. You won’t get an error or a warning in normal output.
JaCoCo must produce XML, not binary .exec files. The old sonar.jacoco.reportPaths property that accepted binary format is deprecated. Python's coverage.py must output Cobertura XML (coverage xml), not the .coverage binary or HTML report. JavaScript coverage must be LCOV, not JSON or Clover format.
Open the report file. XML starts with <?xml. LCOV starts with TN: or SF:. If you see binary data or HTML tags, you have the wrong format.
Does the scanner property point to the right file?
The scanner needs a property telling it where to find the report. Paths are relative to the directory where sonar-scanner runs (usually the project root). A report at build/coverage/lcov.info with a property set to coverage/lcov.info won't be found.
Check your sonar-project.properties file or -D arguments:
# Java
sonar.coverage.jacoco.xmlReportPaths=target/site/jacoco/jacoco.xml

# JavaScript / TypeScript
sonar.javascript.lcov.reportPaths=coverage/lcov.info

# Python
sonar.python.coverage.reportPaths=coverage.xml
Does the scanner run after the coverage report is generated?
A common CI mistake occurs when the sonar-scanner step starts before tests finish, or runs in a parallel job that doesn't wait for the test step. The scanner step must explicitly depend on the test step in your pipeline.
Do file paths in the report match the project structure?
The paths inside the coverage report must match how sonar-scanner sees your source files. Three common mismatches:
- Python in CI: Set
relative_files = Truein.coveragercorpyproject.toml. Without it, coverage.py writes absolute container paths (/home/runner/work/my-project/...) that SonarQube can't resolve to your source tree which produces silent 0% coverage with no error. - Monorepos: If the scanner runs from the repo root but the coverage report references files relative to a subdirectory, paths won't match.
- Multi-module Maven: Aggregated JaCoCo reports may use module-relative paths. Use JaCoCo's
report-aggregategoal with properly configured source sets.
Is the property name correct and current?
Deprecated or misspelled property names silently produce 0% coverage. These are the ones that catch people:
No warning, no error message; the scanner just doesn't find coverage data. Any misspelled property name fails the same way. Copy your property name and check it against the test coverage parameters reference.
Check the scanner logs
If everything above looks correct, run the scanner with the -X flag for debug output. Search for:
Sensor JaCoCo XML Report Importer(Java) to confirm it found the report- The word
coverageto find how many files had coverage imported. If the log says 0, the report wasn't found or wasn't parseable WARNfor unresolved file paths or missing reports
0% coverage?
  |-- Using automatic analysis? -> Switch to CI-based
  |-- Report file exists? -> Check build config
  |-- Report in right format? -> XML/LCOV, not binary
  |-- Scanner property correct? -> Check name + path
  |-- Scanner runs after tests? -> Fix CI step order
  |-- File paths match? -> Check relative_files, monorepo paths
  |-- Property name current? -> Check for deprecated names
  |-- Still 0%? -> Run scanner with -X, search for "coverage"
Why your numbers don't match
You fixed the 0% problem and coverage appears on the dashboard; but coverage.py says 57% and SonarQube says 38%. Or JaCoCo says 44% and SonarQube says 42%. The tools aren't broken, they’re just counting different things.
Take a Python calculator with four methods, where tests cover add() and the happy path of divide() but skip classify() and sqrt(). coverage.py reports 56.5% line coverage. SonarQube reports 37.5%, a 19% gap on the same code, with the same tests.
This is because in Python, def is an executable statement that runs at class load time, binding the function object to a name. When any test imports the module, every def line executes, even for methods the test never calls. coverage.py counts those def lines as coverable and covered, and it does the same for import and class lines. SonarQube doesn't count any of them as executable, because they aren't logic statements.
The five def lines, one import, and one class declaration inflate coverage.py's numerator (all seven are "covered") without adding any real coverage signal. A developer who sees 57% in pytest output and 38% on the dashboard assumes SonarQube is wrong. SonarQube is measuring what percentage of your logic ran during tests, whereas def lines executing at import time tells you nothing about whether the method's body was tested.
The same principle applies at a smaller scale in other languages. In Java, JaCoCo operates at the bytecode level, and the compiler maps return bytecode to method-closing braces. SonarQube doesn't count closing braces as executable statements. For a simple add() method:
public int add(int a, int b) {
    lastResult = a + b;       // Both tools: coverable, covered
    return lastResult;        // Both tools: coverable, covered
}                             // JaCoCo: coverable    SonarQube: not counted
The same pattern repeats for divide(), classify(), and getLastResult(), each contributing one or two closing braces to JaCoCo's count that SonarQube ignores. Across the full class, JaCoCo counts 18 coverable lines (including 6 braces) to SonarQube's 12. The gap: JaCoCo says 44.4%, SonarQube says 41.7%. It’s only ~3% because the counting difference is limited to braces.
Two root causes explain every discrepancy:
Different denominator. Each tool defines "coverable line" differently. SonarQube counts executable statements only. coverage.py includes imports, class declarations, and function definitions. JaCoCo includes closing braces, and Istanbul includes class declarations and method signatures.
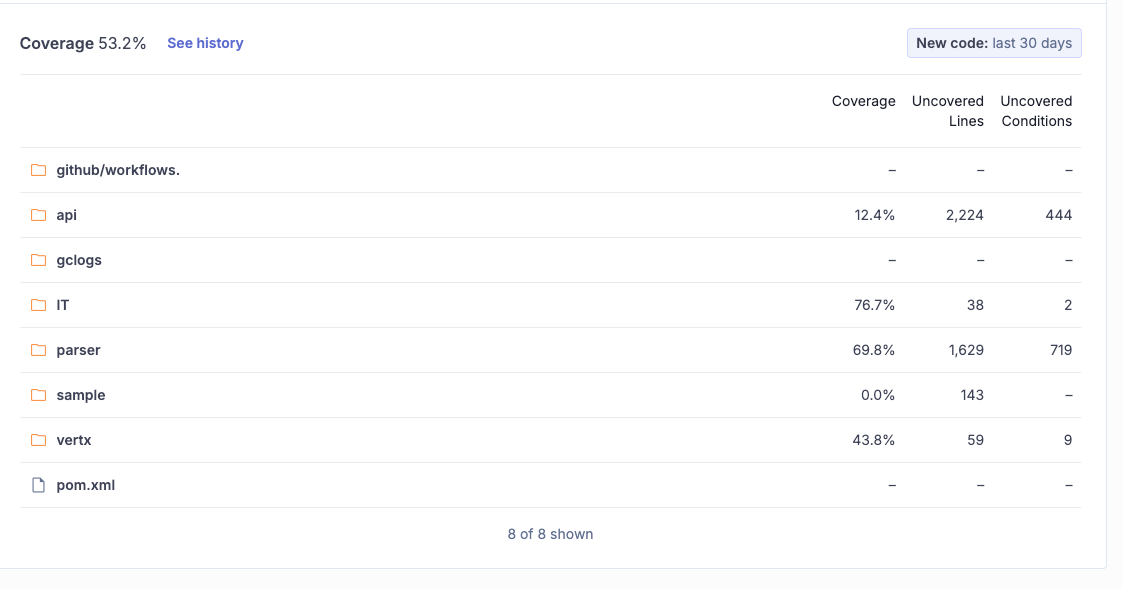
Different file scope. Coverage tools report only on files loaded during testing, but SonarQube includes all project files. In an open-source Java project we analyzed, the sample component (143 lines, 0% coverage) drags the overall number down to 53.2% even though IT sits at 76.7%. Untested utility code, generated files, or modules without tests appear at 0% in SonarQube but don't appear at all in your coverage tool's report. SonarQube is showing you the full picture, which is sometimes less flattering. If those files genuinely shouldn't count (generated code, vendored dependencies), exclude them via sonar.coverage.exclusions. This removes them from coverage calculations while still analyzing them for bugs and vulnerabilities. For generated code you don’t want analyzed at all, sonar.exclusions removes files from the entire analysis scope. But untested application code that your coverage tool quietly omitted is worth knowing about.
A third factor compounds both: SonarQube combines line and branch coverage into a single metric.
Coverage = (CT + CF + LC) / (2*B + EL)CT and CF are conditions evaluated to true and false, LC is covered lines, B is total conditions, and EL is executable lines. Each branch counts double because it has two outcomes. With real project data, the math works out to 5,989 / 11,256 = 53.2%, matching the dashboard exactly. JaCoCo reports line and branch coverage as separate numbers, so when you have many untested branches, SonarQube's combined metric runs lower than JaCoCo's line-only figure.
In small, well-tested projects the gap between tools is a few percentage points. In large projects with untested modules or generated code, the gap can be more substantial.
Beyond percentage: when covered code isn't tested
Coverage tells you which lines ran during tests but doesn't tell you whether the tests actually verified anything. A test that calls a method without asserting the result produces full line coverage for that method, but catches zero bugs. SonarQube detects these gaps with rules that analyze test quality, not just test execution.
Tests without assertions (java:S2699). The most common test quality issue. A test that exercises code but asserts nothing provides line coverage without verifying behavior:
@Test
void testAddNoAssertion() {       // Noncompliant: S2699
    Calculator calc = new Calculator();
    calc.add(2, 3);
    // Line coverage: 100% of add(). Bugs caught: zero.
}
SonarQube flags this as a BLOCKER. The rule recognizes assertions from many popular frameworks including JUnit, AssertJ, Mockito, and Hamcrest, so it won't flag tests that use a supported assertion library.
Assertions that never execute (python:S5915). Subtler and harder to catch manually. An assertion inside a pytest.raises block never runs because the exception exits the block first:
def test_divide_by_zero():
    calc = Calculator()
    with pytest.raises(ValueError):
        calc.divide(1, 0)
        assert calc.last_result is None  # Dead code — never executes
The test passes. coverage.py marks the raise line as covered, but the assertion on the last line is dead code. Moving it outside the with block fixes it. SonarQube flags this as high-impact.
Empty test classes (java:S2187). A class named CalculatorEdgeCaseTest with no test methods shows up in test reports, occupies space in the test directory, and leads someone reading the project to think edge cases are covered. SonarQube flags test classes with zero test methods as a BLOCKER across JUnit 3/4/5, TestNG, and other supported frameworks.
These rules catch problems that coverage percentage misses entirely. AI coding agents frequently generate tests like this with high line coverage and zero meaningful assertions.
What's next
Code coverage reporting in SonarQube is a pipeline, not a button. When the number looks wrong, the question isn't "is SonarQube broken?" but "where in the pipeline did the chain break?"
For language-specific setup instructions, see the SonarQube coverage docs: Java, JavaScript/TypeScript, Python, C#/.NET, Go, and others.