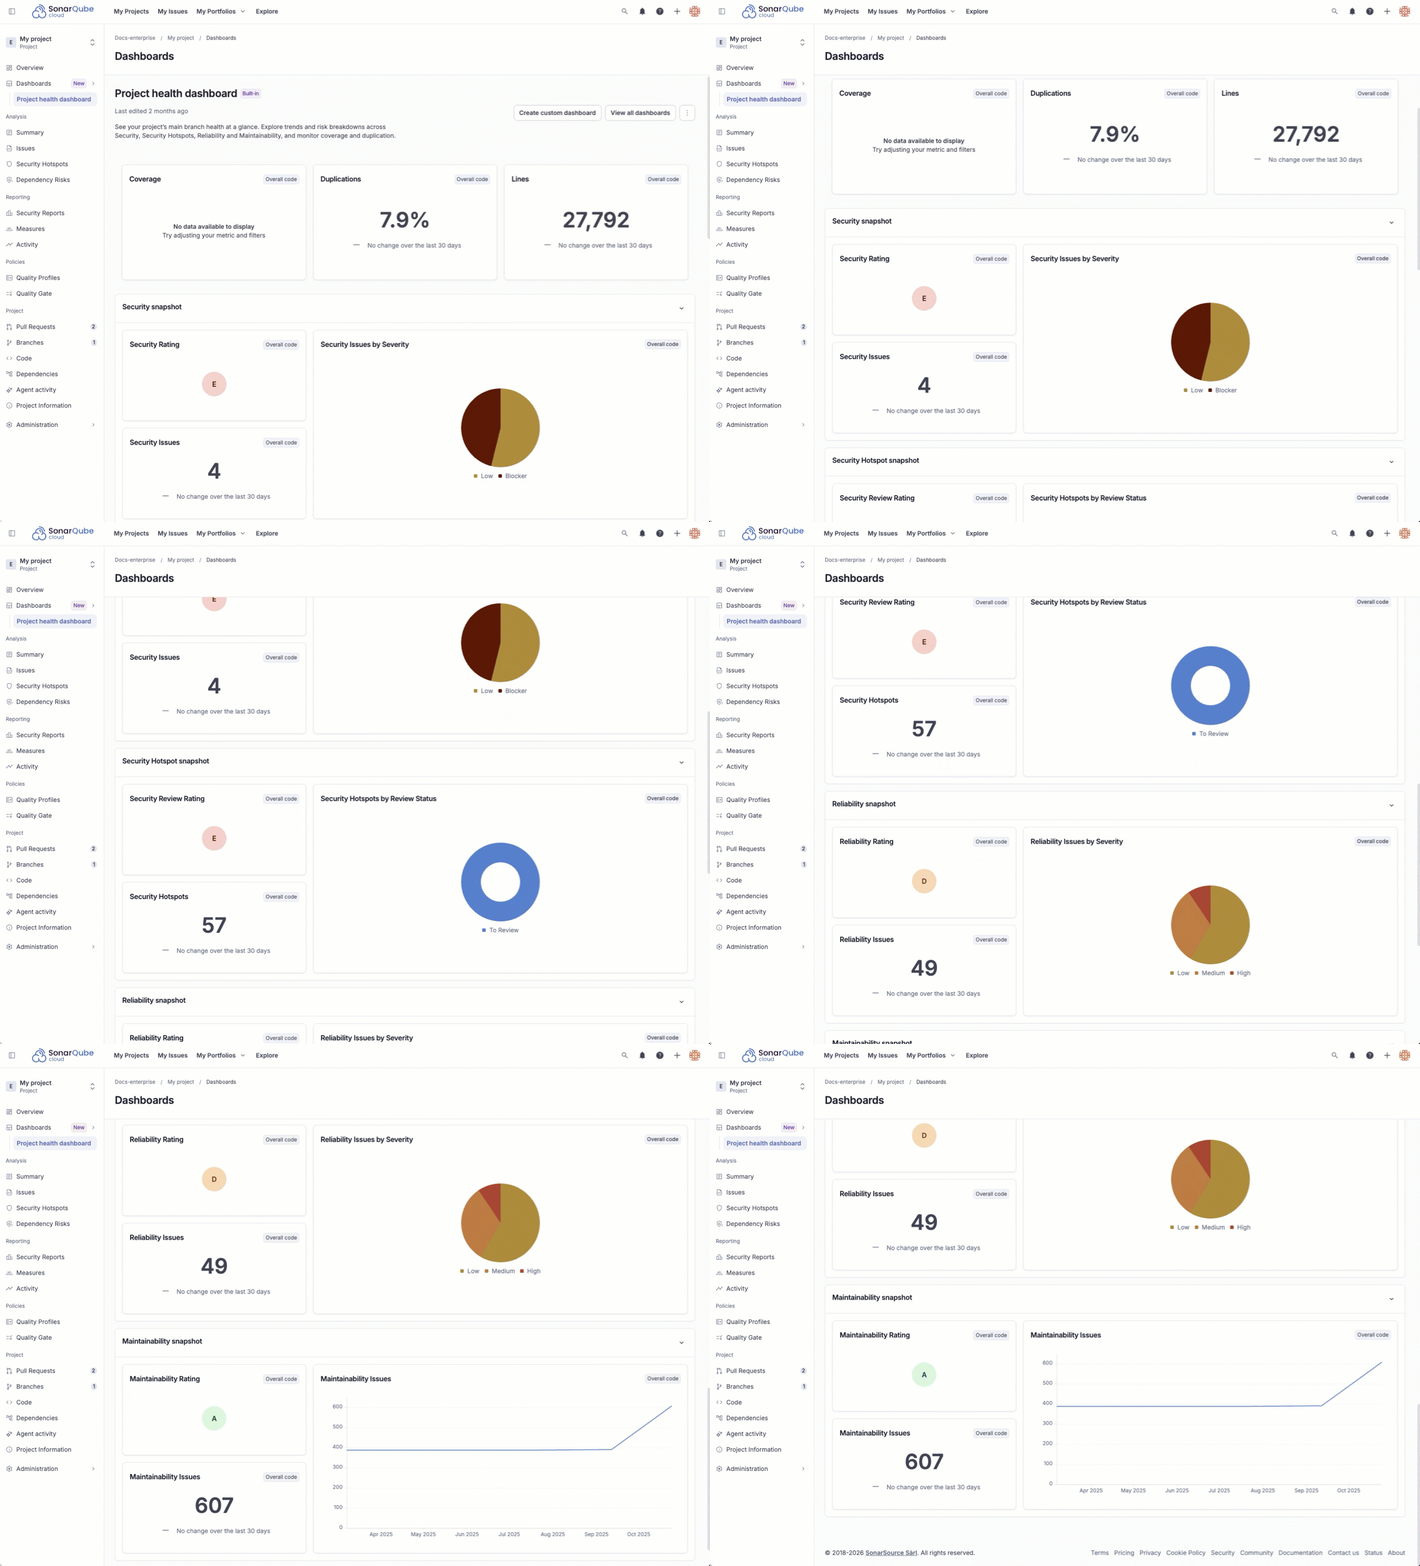
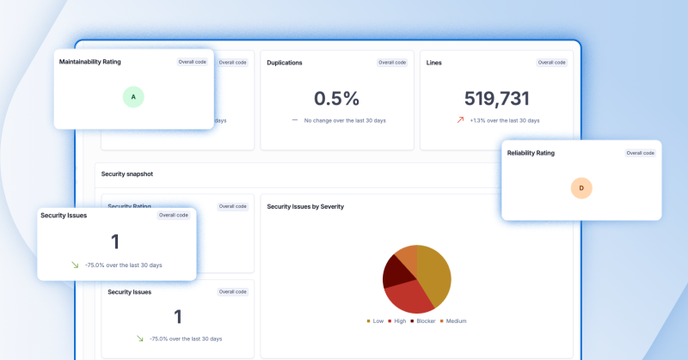
TL;DR overview
- Dashboards in SonarQube Cloud provide a centralized view of code quality and security metrics across projects, enabling teams to monitor quality gate status, coverage trends, and issue counts at a glance.
- The dashboard interface surfaces key indicators including new code quality, overall technical debt, vulnerability count, and test coverage on both new and overall code.
- Teams can use dashboard views to identify which projects need attention and track improvement over time without navigating into individual project details.
- SonarQube Cloud dashboards support the code quality workflow by highlighting new code metrics alongside overall codebase health.
Visualizing key code quality and security metrics for your SonarQube Cloud projects just became easier with the general availability of customizable project dashboards.
For engineering managers, tech leads, and security champions, answering the simple question - "Are we production-ready?" or “What is the most impactful thing I should focus on right now?” - hasn't always been simple. Your most critical data often sits in different views, requiring manual aggregation to build a clear picture of project health.
With the release of project dashboards for SonarQube Cloud Enterprise, we are excited to unveil the beginning of our new custom dashboard platform, designed to provide the strategic visibility needed to monitor key metrics, identify risks, and communicate progress - all from one configurable, actionable place.
Strategic visibility for every stakeholder
Data is only valuable when it is actionable. Our new dashboard platform guarantees that every stakeholder has access to the specific insights they need to maintain engineering velocity, without sacrificing code health.
Whether you are tracking technical debt reduction, or verifying your security posture is improving over time, SonarQube Cloud dashboards ensure:
- Engineering managers can monitor technical debt trends to check teams are on track with quality goals.
- Tech leads can spot spikes in code complexity or duplication, before they become unmanageable.
- Security champions can maintain a dedicated view of vulnerability trends and severity distribution, confirming security posture is improving over time.
Flexible views for complex projects
We recognize that reporting needs vary by team and project. Our dashboards offer flexibility to reflect how you prefer to consume code quality and security data.
1. The project health dashboard (zero configuration)
Every project now comes with a built-in project health dashboard. This provides an immediate, consolidated view of the essential indicators: Security, Reliability, Maintainability, and Coverage. It is designed to give you instant value, without requiring any configuration.

2. Fully customized dashboards
To meet specific needs, you can build your own dashboards from scratch, or duplicate an existing one to use as a template. Use our growing library of widgets to filter by code type (overall vs. new code), severity, or language.
How to build your first dashboard
Getting started is straightforward. You will find the new Dashboards item in your project's main branch menu.
To build a custom view:
- Navigate to All Dashboards and select Create.
- Choose to start from scratch, or duplicate an existing dashboard.
- Enter Edit Mode to add and arrange widgets like trend lines, donut charts, and health indicators. You can group themes of widgets using layout sections.
A practical example
Let’s say you want to create a security-focused view. You can create a specific "Security" section in your dashboard and populate it with:
- Trend line charts: To visualize how the number of code security issues is trending over time.
- Donut charts: To break down issue counts by severity or language.
- Trend indicators: To see at a glance if your metrics are improving or degrading compared to the previous period.
You can then arrange these widgets to tell the specific story your stakeholders need to see.
Watch it in action
To see a step-by-step walkthrough of building a custom dashboard, check out our video guide.
Availability and requirements
This feature is available now for all SonarQube Cloud Enterprise plan customers.
If you are currently on an Enterprise plan, you can access dashboards immediately in your project menu. If you are not yet on Enterprise and want to unlock these advanced reporting capabilities, speak to our sales team about an upgrade.
Your feedback is a gift
This milestone marks the beginning of our new insight engine. We are committed to expanding our library of widgets and pre-built dashboards, based on your requirements. We want to build what you need most.
Please post your thoughts, widget requests, and feedback on our dedicated Portal card.
For more detailed technical information, please refer to the official dashboards documentation.

